

28 min read • Automotive
The future of automotive mobility, 2024
The CASE paradigm confronts reality


FOREWORD
This fourth edition of the Arthur D. Little (ADL) “Future of Automotive Mobility” global end-user study builds upon previous editions to deliver insights based on extensive primary customer research. First conducted in 2015, the study identifies disruptions and trends for the future, providing the intelligence that industry actors need to meet changing customer requirements in different parts of the world. For this edition, we analyzed a sample of over 16,000 users from an unprecedented 25 countries, which collectively accounts for over 80% of global new car registrations.
Our research shows that the simple view of unidirectional progress toward a connected, autonomous, shared, and electric (CASE) world is increasingly untenable, as both producers and consumers reassess costs and benefits; it also confirms trends identified in previous editions of this study. The immediate world of automotive mobility will be connected, assisted (not autonomous), private, and in a protracted transition to electric.
Moreover, we see significant and increasing divergence between the mature markets of the US, Europe, and North Asia, which are at peak motorization, and the more dynamic, yet price-sensitive, markets of the rest of Asia and the Middle East.
Richard Parkin
Partner
Automotive and Growth Practices
EXECUTIVE SUMMARY
POWERING THROUGH CURRENT AUTOMOTIVE CHALLENGES
During the early 2000s, many automotive industry commentators predicted that we would be well on our way by now to living and driving in a CASE world.
A tap on our smartphone screen would summon a zero-emission, driverless vehicle to our door, ready to whisk us to our destination in comfort, with connected apps keeping us in constant touch with the world around us. At the end of our journey, the vehicle would glide away to its next passenger, leaving us free from worries about ownership, maintenance, and parking.
However, previous editions of the “Future of Automotive Mobility” study, along with the actions of OEMs, confirm that expectations of a CASE future have not yet universally translated into reality. While cars are now connected and well on the way to being electric, they are assisted rather than autonomous and remain individual (or private) rather than shared. The industry increasingly recognizes this: launch dates for fully autonomous vehicles have been pushed back or canceled, and strategies are shifting from full autonomy to promoting advanced assisted driving.
This edition of the study addresses the following five topics:
- User mobility profiles and car ownership
- New mobility services
- Autonomous driving
- Alternative drivetrains, including electric vehicles (EVs), and charging infrastructure
- The impact of digital tools on sales models
Based on our analysis, the sector needs to act on four key challenges, in particular:
- Drivers must be convinced to embrace more sustainable motoring and move from internal combustion engine (ICE) vehicles to meet requirements to reduce still-increasing transport carbon dioxide (CO2) emissions. This change is not only critical for achieving decarbonization; it also delivers returns on the growing investment made by the industry in transitional hybrid and battery electric vehicle (BEV) technologies.
- Companies must meet regulatory challenges linked to decarbonization, such as tightened emissions regulations, which include low emissions zones and bans on the sale of ICE vehicles, while ensuring they reap the financial benefits of government incentives, such as the US Inflation Reduction Act (IRA). At the same time, they must navigate growing geopolitical rivalries between the US, Europe, and China, which affect operations, especially global supply chains.
- Existing manufacturers need to address the impact of new disruptors, such as Chinese EV-native OEMs joining the likes of Tesla to increase competition and decrease brand loyalty, which intensifies pressure on pricing and speed of innovation.
- Both manufacturers and retailers must continue to digitize their sales operations to ensure that customers can move between digital and physical purchasing options according to their preferences. While massive strides have been made with products (e.g., connected cars and software architecture), opportunities remain in terms of sales channels and customer experience. Understanding the customer dimension is central to setting the right strategy.
CASE MEETS REALITY
Revaluating the journey
For the past 15 years, the automotive industry’s future has been framed around the concept of CASE:
- Connected. Fully digital, connected vehicles constantly share data to enable new services, including entertainment, safety, navigation, fuel efficiency, and maintenance.
- Autonomous. Level 4 (L4) and Level 5 (L5, high driving automation/full driving automation) vehicles operate with a high degree of autonomy and are essentially self-driving.
- Shared. On-demand, shared models increasingly replace individual car ownership, reducing costs for users through increased asset utilization and opening new revenue streams for OEMs.
- Electric. Electric powertrains become dominant, replacing ICE vehicles to reduce emissions and transform the driving experience.
How far down the road to CASE are we? Combining our global customer research with other sources shows a picture that is substantially different from the one we expected just a few years ago:
- Connected. While this has become the standard in areas such as navigation, entertainment, safety, maintenance, and service, the connected interface is often the owner’s smartphone rather than the connected services offered by the manufacturer.
- Autonomous. There is limited customer interest in higher-level L4/L5 autonomy, due to ongoing safety concerns. L2/L3 (partial driving automation/conditional driving automation) delivers the benefits that most customers want, without requiring changes to the regulatory environment needed for L4/L5. At the same time, OEMs have advanced far less on autonomy than originally planned, primarily due to other demands on capital, such as creating new software architectures and developing EVs.
- Shared. Car sharing, while growing, remains at only 3% of the global shared mobility market (US $3 billion of a $100 billion market). It has failed to take off as operator after operator has struggled to develop a viable business model, primarily due to low utilization and high changeover costs between drivers. Moreover, car OEMs have progressively exited the business.[1] Ride hailing via digital apps has instead seen the fastest growth and heaviest use. For all the talk of widespread de-motorization, this change remains limited to wealthy, Western, urban areas where high-quality public transport is in place.
- Electric. BEV is becoming the mainstream technology, as battery costs decline and range increases while infrastructure continues to improve. Northern Europe (Norway and the Netherlands) and China lead BEV adoption. However, there are significant numbers of ICE holdouts, especially in the US, and many customers are choosing hybrids over pure EVs.
Navigating the future
Uneven progress toward CASE points to the challenges the automotive industry faces now and in the future. In addition to making investments to electrify powertrains and redefine vehicle software architectures, it must cope with disruption by new entrants, heightened sustainability pressures, and changing customer needs. These considerations are set against the backdrop of tightening regulations, geopolitical turbulence, and potential national and regional tariffs on an industry that strives to operate globally.

1
MOBILITY PROFILE & CAR OWNERSHIP
MOTORIZATION IS ACTUALLY GROWING
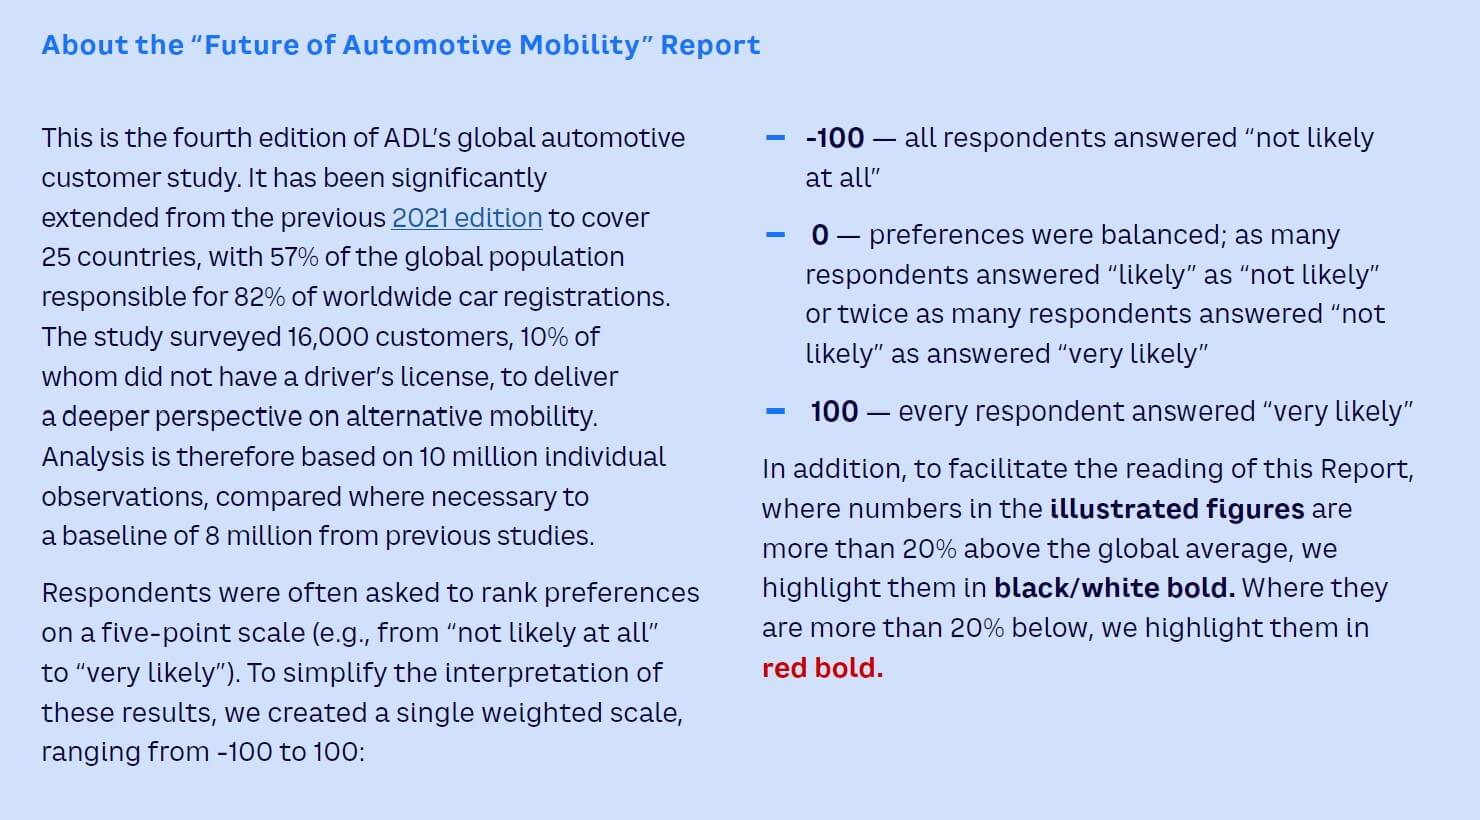
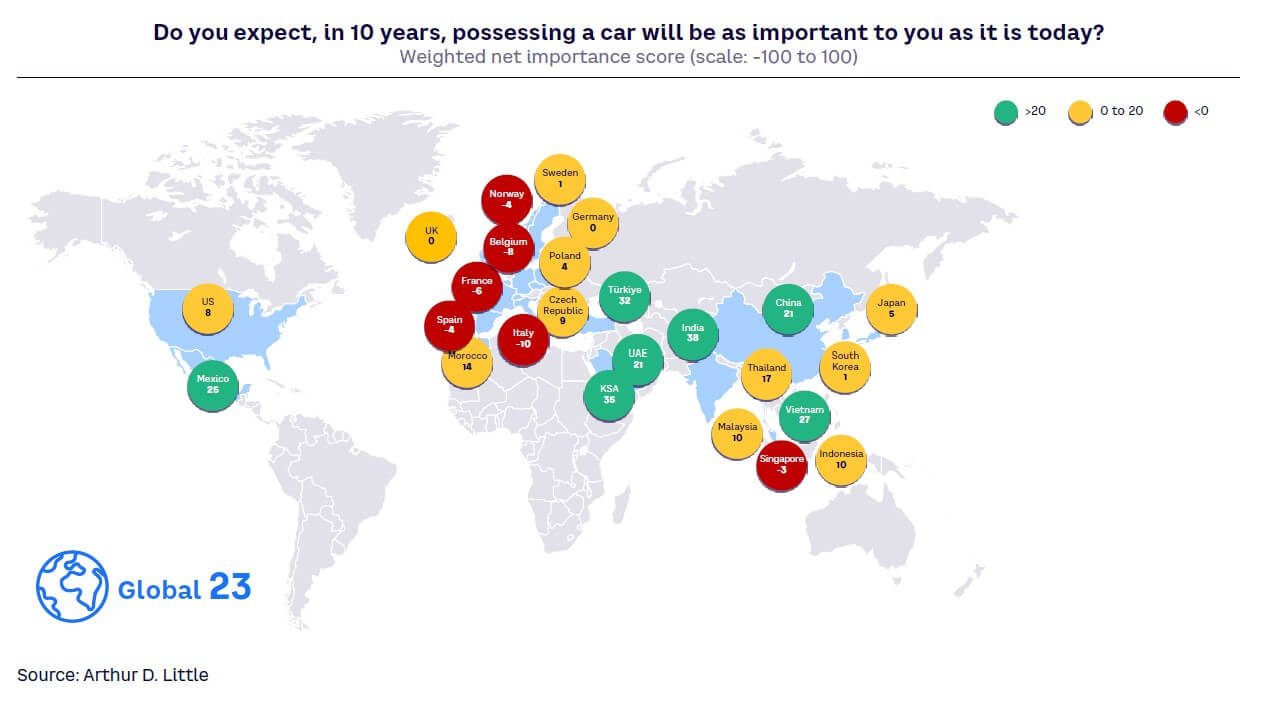
Despite earlier predictions that the importance of car ownership car will decrease, the number of vehicles on the world’s roads is growing, not shrinking. Globally, users believe that having their own vehicle will be equally or more important in 10 years’ time (see Figure 1[2]) compared to today. This outlook is driven by three trends:
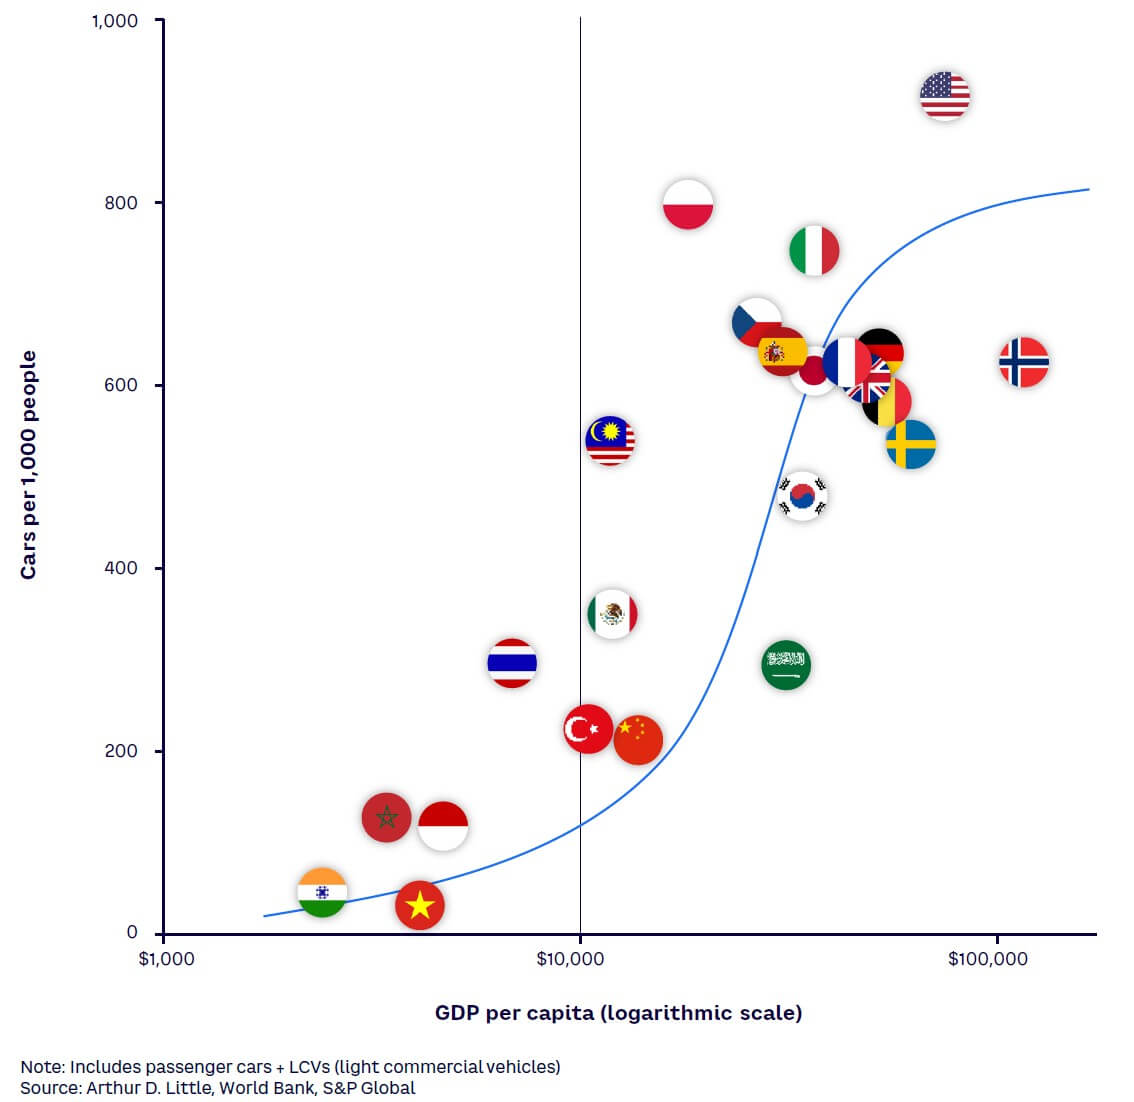
- Large-scale increases in car ownership in developing markets, due to economic growth. The traditional S-curve relationship between GDP per capita and cars per household continues to hold, with rapid growth in car ownership above $5,000 GDP per capita, reaching a plateau at average annual incomes above $20,000 per capita (see Figure 2).
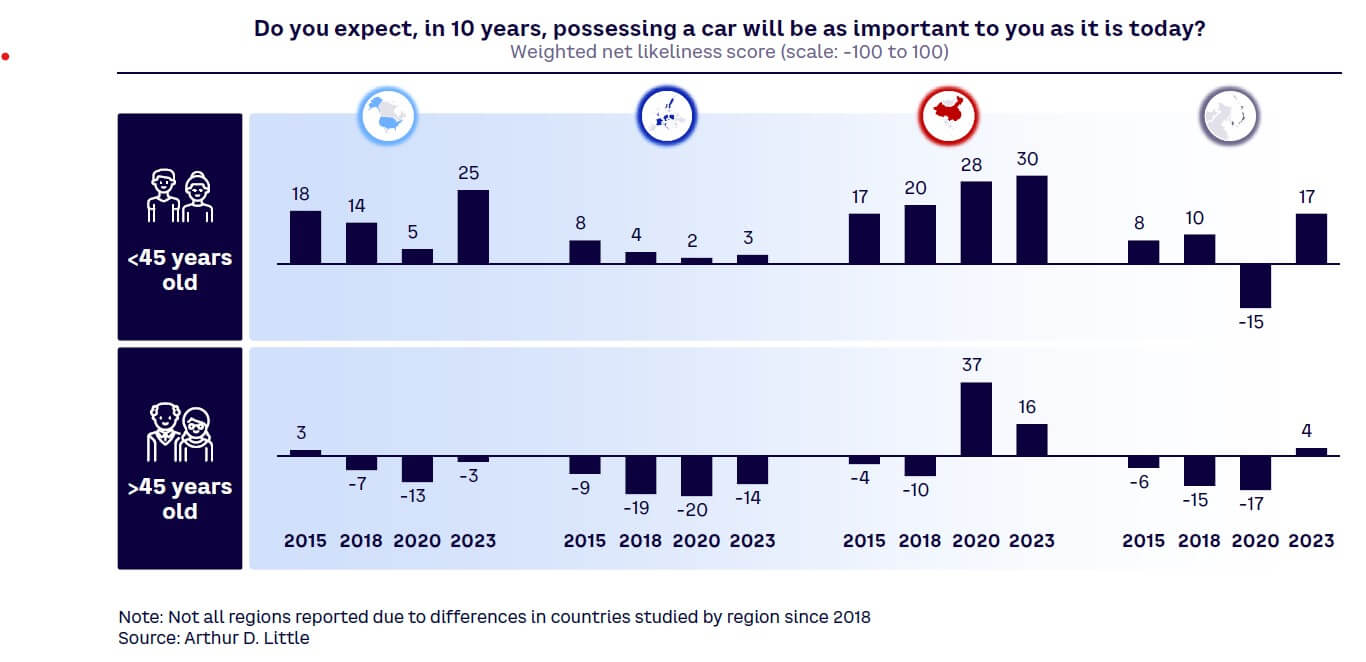
While no single variable alone can explain motorization rates (population density, public transportation availability, and income distribution, among others, play a role), real GDP growth is the number one factor by far. - Greater reliance on cars, as people age and their living conditions and mobility needs entail shifts in preferences (see Figure 3).
- Car ownership as a necessity, where it is the cheapest and/or easiest form of mobility; for example, in the US, mostly low-income groups report that they would not give up their cars, while those in rural communities and smaller towns drive the furthest on average per year. These elements of spatial structure and public transportation infrastructure explain the different levels of the plateau (e.g., 0.7 cars per capita in the US versus 0.4 to 0.6 in most Organisation for Economic Co-operation and Development [OECD] countries).
Among our sample, expectation of de-motorization is not widespread; it is limited to Western Europe and densely populated areas in Asia (e.g., Singapore and Hong Kong). Expected de-motorization is essentially a wealthy, urban phenomenon, with high-quality public transportation a prerequisite. Three-quarters (76%) of those in European cities with a population of over 5 million are prepared to give up their car, compared to 62% in towns with under 250,000 people. ADL’s “Future of Mobility” city ranking[3] is led by cities such as Singapore, Stockholm, Amsterdam, and Copenhagen, which have highly mature, cost-effective public transport and strong support for alternative mobility types like cycling.
Relatedly, there is an inverse correlation between city size and car usage. In cities with over 250,000 inhabitants, around half of respondents drive under 6,000 km a year. In smaller towns and suburban environments (under 250,000), people who drive between 6,000 and 15,000 km are the majority. Two-thirds (67%) of those in towns with a population of under 10,000 drive over 6,000 km each year.
Young people expect the importance of having a car to be higher in 10 years, even in mature markets such as Europe and North America. Only the older age group (over 45) in Europe and North America expect to de-motorize as they age (refer back to Figure 3).
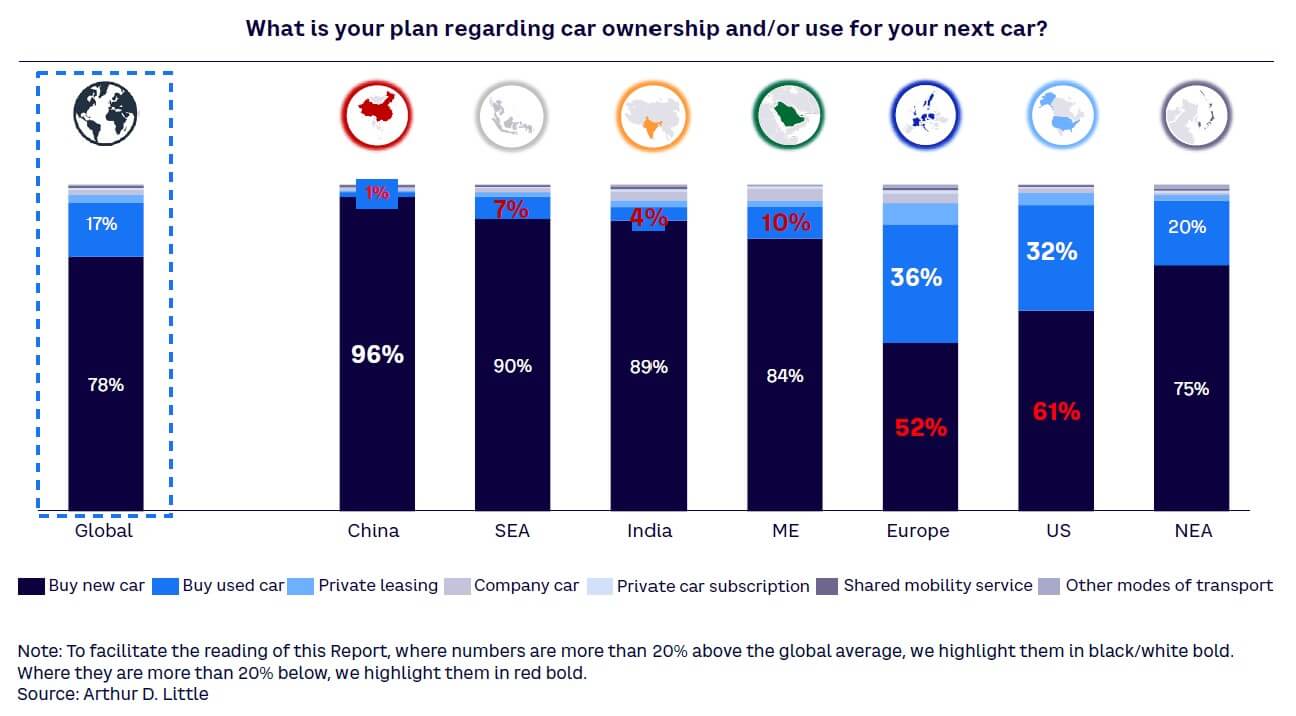
WHAT DO DRIVERS WANT IN THEIR NEXT CAR?
When deciding on their next vehicle, customers in mature markets are much more likely to choose a used car compared to those in emerging regions, such as China and India (see Figure 4). This is partly aspirational in terms of a desire to own a new vehicle but is also due to the availability of quality used vehicles. Mature markets have a plentiful supply of a broad range of used cars, often sourced from a well-developed leasing market and backed by a trusted used vehicle distribution brand. These conditions drive higher trust in the quality of used vehicles and in used car sales channels.
2
NEW MOBILITY SERVICES
There is no general trend away from car ownership or toward shared transportation visible in our data. The study shows a lack of interest in giving up personal car ownership, as it is still considered essential for many, particularly in areas without good public transportation. Owning a car is also an aspiration for people under 45 as they move into middle age and for those in less-motorized parts of the world.
When asked what would persuade them to give up their personal car, respondents cited new, lower-cost mobility services (50%) and high availability of such services (38%). However, 28% would not consider giving up their car under any circumstances.
Among alternative mobility methods, traditional choices of public transport or ride hailing (which no longer only includes taxis) remain the most popular.
Car manufacturing is therefore not under threat from de-motorization in the vast majority of markets. However, tightening legislation and increasing urbanization could reduce car demand over the longer term. To increase their share of mobility and user numbers, public transport authorities and operators should focus on improving the availability and quality of the services they offer.
TRYING NEW SERVICES IS UNUSUAL
When it comes to experimenting with new services, China (up to 50%) and India (up to 45%) have the highest percentages of urban residents who have tried car and ride sharing. However, as shown in Figure 5, neither service is mainstream, as less than 50% of respondents have tried them. Traditional public transport remains strong, especially in Europe and China.
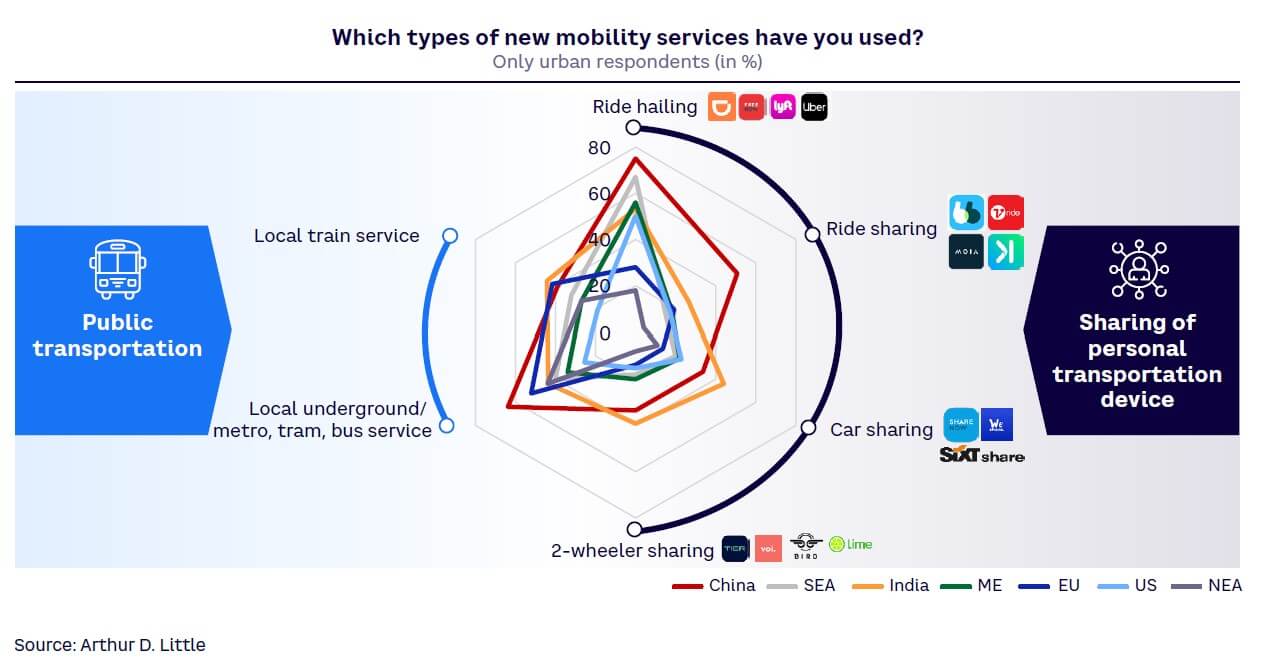
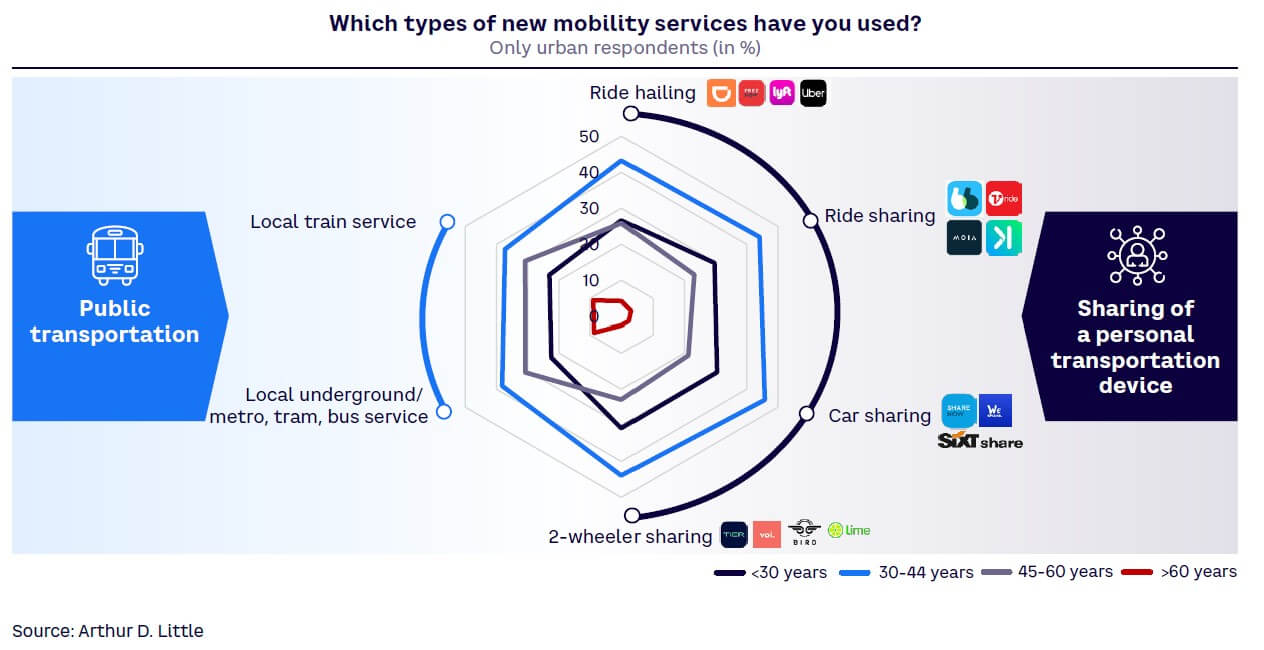
In fact, the most often experienced new mobility service for urban respondents is ride hailing, tried by 50%-75% of people in every region or country except Europe and Northeast Asia. Globally, those in the 30-44 age range are the heaviest experimenters, with about 45% trying ride, car, or two-wheeler sharing, compared to only about 5% of people over 60 who have tried most service types (see Figure 6).
NEW MOBILITY SERVICES FOCUS ON RIDE HAILING
There are significant regional differences in the use of new mobility services, influenced by car ownership rates and access to reliable, comprehensive public transport. Urban dwellers in India, Southeast Asia, and the Middle East make an average of 14 to 17 journeys each month using new mobility services, compared to residents of Europe, the US, China, and Northeast Asia, who make dramatically fewer, between 11 and 12 (see Figure 7).
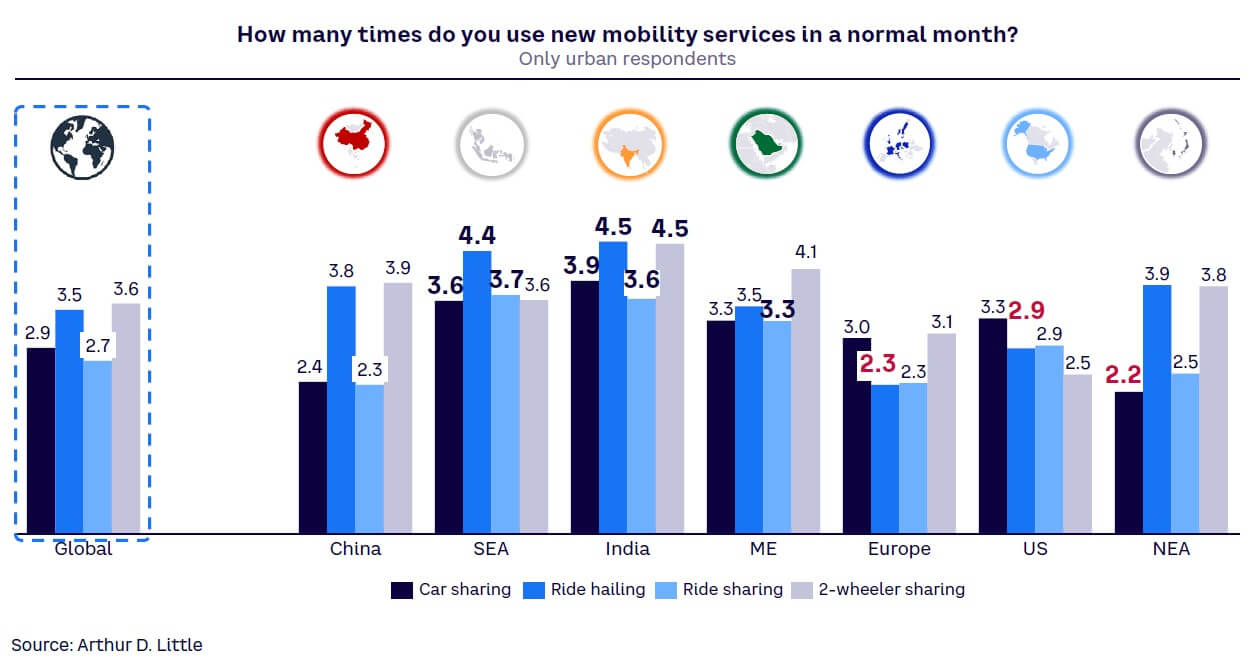
Globally, ride hailing usage occurs, on average, 3.5 times per month, with usage being higher in all parts of Asia and lower in the US (2.9 journeys) and Europe (2.3 journeys). Car sharing is the most popular new mobility service in the US, with users taking an average of 3.3 monthly journeys.
WHAT DRIVES ADOPTION OF NEW MOBILITY SERVICES?
When asked why they choose new mobility services, respondents listed flexibility (62%), cost (52%), and the environment (44%) as their top three reasons, as shown in Figure 8. Flexibility covers a range of areas — customers don’t need to own or maintain a vehicle, battle traffic in congested urban areas, or find parking; they can also switch easily between different transport modes. Flexibility is clearly the number one reason for using new mobility services everywhere outside Europe (where cost slightly outweighs it) and the US (where cost is almost as important as flexibility).
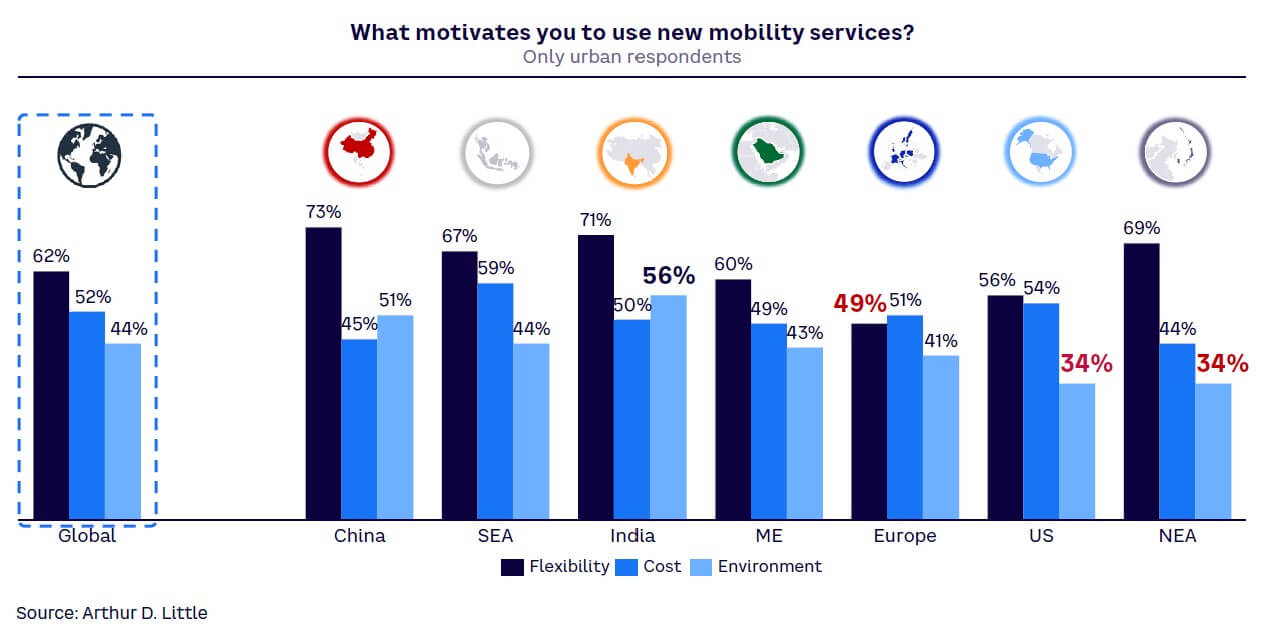
Income had a minor impact on the reasons for choosing new mobility services among urban respondents. However, cost unsurprisingly increased in importance for lower-income groups, while flexibility and environmental considerations decreased:
- Very-high-income groups — 66% cited flexibility as the key reason, 47% said cost, and 51% cited the environment.
- Low-income groups — 58% chose flexibility as a key factor, 55% cited cost, and 44% cited the environment.
When asked what changes to new mobility services would encourage people to give up their cars, the major areas respondents highlighted globally are cost (50%) and availability (44%). Twenty-eight percent would not give up their cars under any circumstances. There are significant regional differences: 77% of Chinese respondents require greater availability to replace their cars with mobility services; 75% of Indians cite improved ease of use; and nearly half (49%) of US respondents and 37% of those in Europe would not give up their car under any circumstances. Essentially, to increase the adoption of new mobility services, people require lower costs, higher availability, greater flexibility, improved reliability, and increased quality. This combination of requirements for higher service and lower cost typically makes the “shared” element of CASE unviable economically.
3
AUTONOMOUS DRIVING
Five years ago, the first L4/L5 production cars for private users were projected to be available by the second half of the decade, with rapid ramp-up thereafter. However, traditional OEMs have pushed their projects back, with new entrants such as Apple and Alphabet either downgrading or discontinuing long-term projects. OEMs and operators are now limited to piloting operations carried out under special permits and more controlled conditions.
WHAT DRIVES DIFFERENCES IN AUTONOMOUS ACCEPTANCE?
Despite technological progress and demonstrably improved safety over human-driven cars, the level of trust in autonomous driving technology has not significantly increased over the past five years, illustrating the lack of customer acceptance. In some geographic areas, trust has actually decreased, often due to well-publicized incidents and a failure by operators to effectively communicate its benefits. High-profile incidents in San Francisco, California, involving self-driving taxis run by Cruise and Waymo, with the vehicles crashing into fire trucks, striking pedestrians, and being vandalized by mobs, attracted a disproportionate amount of attention.
We see clear differences by income/location, with urban very-high-income and high-income respondents most positive on autonomous technologies (see Figure 9).
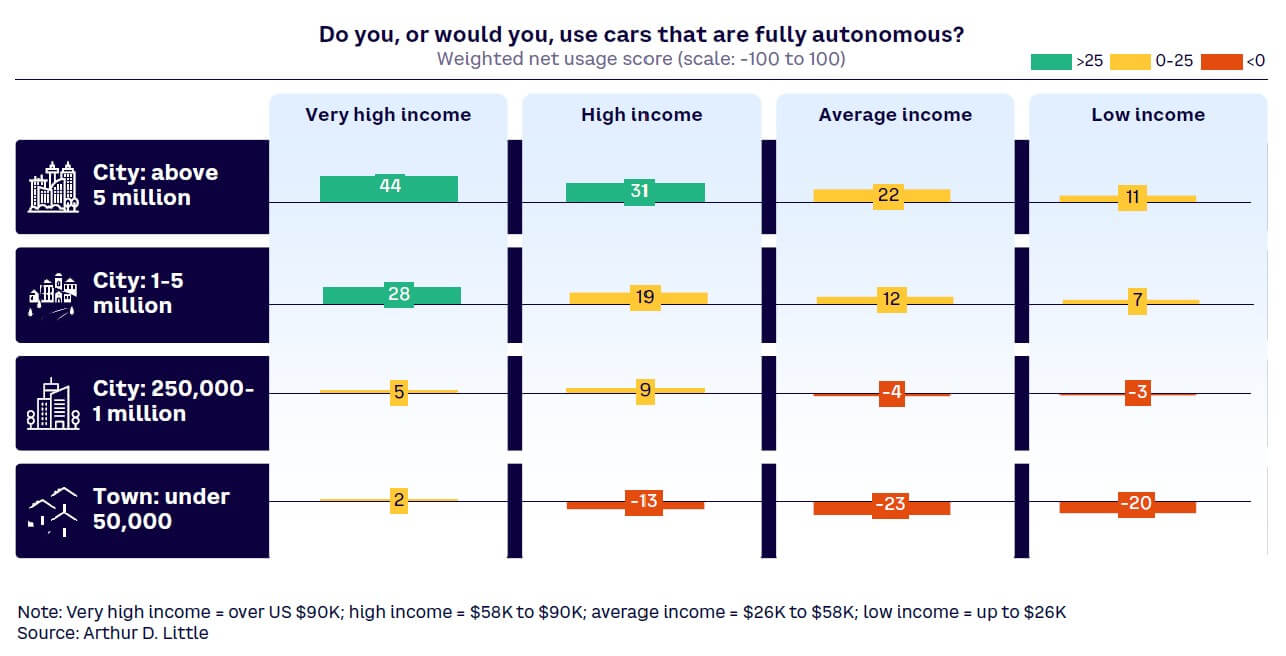
This correlation between income and acceptance of autonomous driving holds in all regions, though the threshold for acceptance varies. In China, we see 34% net approval at average income and city size between 1 and 5 million people, while in the US we need to move to cities with 5 million inhabitants and high incomes to see similar net approval levels.
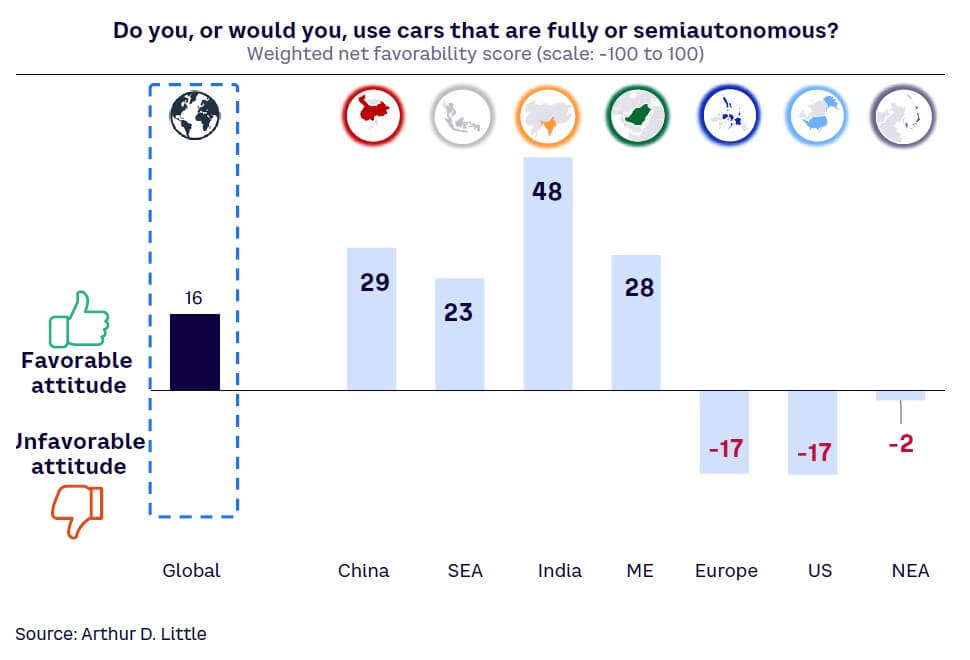
European, Northeast Asian, and US respondents are the least willing to adopt autonomous vehicles, while those in India, China, and the Middle East demonstrate a much more favorable attitude (see Figure 10).
THE IMPORTANCE OF SAFETY TO ACCEPTANCE
Mirroring the examples cited above from California, the primary concern with autonomous driving across all incomes and regions is safety, encompassing both machine and human errors, as shown in Figure 11.
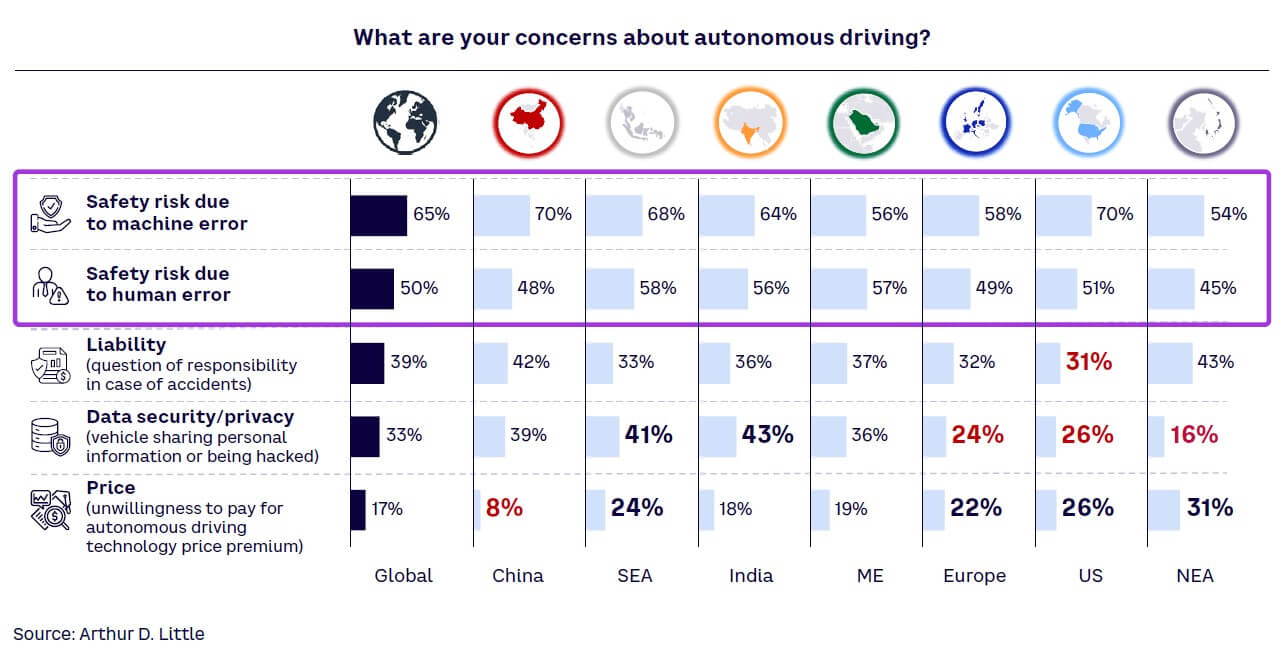
User concerns about safety mainly reflect the still-immature technology for L4/L5 autonomous driving and a resulting lack of positive experiences reported in the media. People are aware that current autonomous vehicles depend on backup human drivers who are ready to intervene, must go slower than a human driver, and only operate in dedicated environments with special infrastructure. The promised benefits of automation around convenience and ease of use have not materialized yet. On the contrary, recent incidents in the US, which led to pausing trials of the most advanced robo-taxis, coupled with high-profile stories on crashes of private vehicles, have not helped to increase customers’ confidence in the maturity of the technology.
However, if these safety fears could be overcome by positive user experiences, it would lead to greater usage of personal autonomous vehicles. When asked whether a fully autonomous car would increase or decrease their car usage, all respondents globally gave an average weighted score of +4, rising to +26 for those who were positive about autonomous driving. Again, this was highest in India, with a score of +32 for all respondents and +42 for those open to autonomous driving. This increased usage would replace:
- Existing personal non-autonomous vehicle (51%)
- Public transport (44%)
- Taxis (32%)
Overall, since 2015, the expectation of the percentage of public transport journeys potentially replaced with autonomous cars has grown, which would represent a switch from shared to personal mobility options.
4
ALTERNATIVE DRIVETRAINS & CHARGING INFRASTRUCTURE
New registrations of BEV and plug-in hybrid electric vehicles (PHEV) continue to grow across the world, reaching a high of 14 million in 2023, according to the International Energy Agency (IEA)[4] — 9.5 million BEV and 4.3 million PHEV. The total number of EVs on the road increased to 40 million (28.2 million BEV), which closely aligns with the sales forecast from the 2023 edition of the IEA “Global EV Outlook” (GEVO-2023). This represents a growth of 35% in new sales versus 2022. Moreover, this is more than six times higher than 2018 registrations. In 2023, there were over 250,000 new registrations per week, which is more than the annual total in 2013. Electric cars (PHEV and BEV) therefore accounted for around 18% of all cars sold in 2023, up from 14% in 2022, and only 2% in 2018. PHEVs and BEVs made up 38% of new car sales in China, 21% in Europe, and 10% in the US.
These trends indicate that growth remains robust as electric car markets mature. BEVs accounted for 70% of the electric car stock in 2023. However, multiple factors are affecting the pace of continued growth:
- Maturity in the most advanced markets, such as Norway, where over 80% of new registrations are BEVs, leaves little room for further growth.
- Government incentives for BEV purchases are being reduced or eliminated; in Germany, for example, the end of its subsidy program in 2023 led to a reduction in EV purchases of over 25%.
- Some vehicle segments, such as small and family cars, station wagons, and large SUVs are still not fully served by EVs.
- There is still uneven development of charging infrastructure.
The up-front price of EVs remains higher than their ICE counterparts in many markets, resulting in purchase hesitancy. These concerns are reinforced by the fact that residual values are hard to predict, with rapid changes in EV battery and charging technologies leading to worries about vehicle depreciation rates.
However, “fear of the new” is the most important barrier to EV adoption — most potential buyers have not yet experienced EVs and have prejudices and preconceptions about them. In the US, this effect is reinforced by the increasing politicization of discussions about vehicle powertrains.
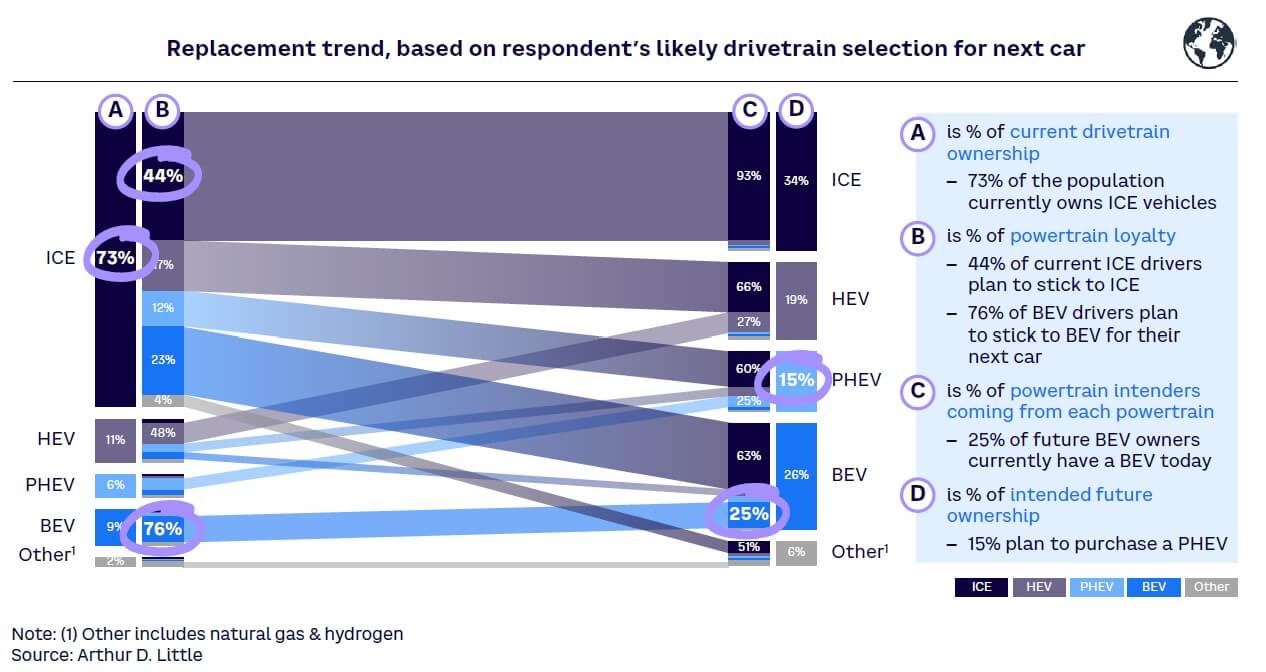
WILL CUSTOMERS’ NEXT VEHICLES BE ELECTRIC?
Globally, nearly 90% of our respondents currently own a vehicle with an internal combustion engine, of which 73% are pure ICE, 11% are hybrids, and 6% are plug-in hybrids (see Figure 12). Nine percent of respondents currently have a pure battery EV. Figure 12 shows what these customers told us about their expected next vehicle. For example:
- ICE (without any electrification) is rapidly declining. 73% of the current sample are pure ICE, while only 34% of buyers expect to replace their current vehicle with a pure ICE car:
- 93% of these ICE purchases come from current ICE vehicle owners who plan to stick to their current powertrain.
- The remaining 7% comes from a small number of hybrid and EV owners returning to ICE.
- Many buyers seek the reassurance of a hybrid during the transition from ICE powertrains:
- 30% of current ICE buyers expect to go hybrid, with a smaller share (23%) switching directly to BEV.
- 45%-50% of existing PHEV and hybrid electric vehicles (HEV) buyers will stick with a type of hybrid.
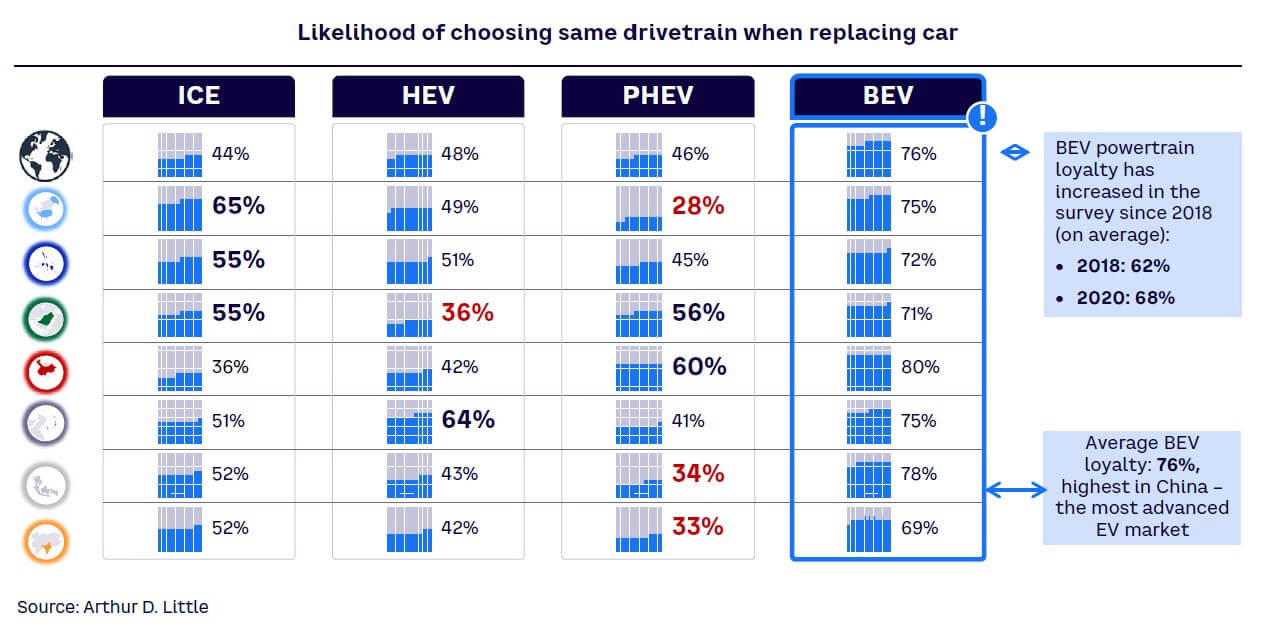
- BEV owners are the most loyal, with 76% expecting to replace their BEV with another BEV, up from 62% when we first measured this in 2018.
Our research supports what we see in the registration numbers: there is a steady move toward BEV, often via hybrid. Yet there is a significant proportion of holdouts, and the numbers in any given market or month are conditioned by government incentives as well as manufacturers optimizing vehicle supply across markets and across time, often driven by threshold effects in regulations.
THE GEOGRAPHIC POWERTRAIN SPLIT
This trend away from ICE vehicles is least visible in the US. In that region, 86% of our sample currently have a pure ICE vehicle and over half (57%) intend to buy the same again, with 27% planning to switch to a hybrid option. Just 12% plan to buy a BEV. Although this means that potentially 43% of the vehicles in the US market will be powered by alternative powertrains, the majority will be hybrids.
In Europe, by contrast, the mix will shift from 82% ICE and 18% alternative powertrain to a 45/55 split based on purchase intentions. Forty-six percent of ICE drivers say they will choose an alternative drivetrain for their next vehicle, while 73% of existing BEV owners state that they will choose one again. However, as in the US, hybrids (HEV and PHEV) are the most common purchase intention, with 18% of respondents intending to choose an HEV, 14% a PHEV, and just 16% a BEV.
China will see the most rapid shift, with pure ICE volumes dropping from two-thirds (66%) of cars to under a quarter (24%), based on purchase intentions. This confirms the current trend of quick EV adoption among Chinese customers and a decreasing presence of ICE vehicles at motor shows in China. Among our sample, BEVs and all hybrids each represent approximately 35% of intentions.
These same trends are evident in the intended powertrain loyalty numbers (see Figure 13), with for example, high ICE loyalty (65%) in the US falling to only 36% in China; 45%-50% hybrid (HEV and PHEV) loyalty (with evidence of a move away from PHEV) in the US, and about 75% BEV loyalty, reaching as high as 80%, in China.
This year’s study demonstrates that BEV and hybrid powertrain vehicles are becoming mainstream across the world, with an increasing significance of purely electric powertrains. ICE sales volumes will drop, less loyal drivers will switch to alternatives, and those who currently own BEVs will buy a similar replacement, with their loyalty rising compared to previous studies. However, hybrids (both PHEV and HEV) will play a strong part in the move away from ICE, comprising about a third of sales. These findings demonstrate that hybrids, rather than being a short-term bridge from ICE to BEV, will play a larger, longer-term role in the powertrain shift. To facilitate the transition, OEMs should ensure that these hybrids provide sufficiently high pure-electric driving ranges to educate drivers about the potential of electric power while accelerating decarbonization.
This study suggests that combustion engines may still play a role for consumers in hybrid powertrains for years to come — if and where they are in line with emissions regulations.
WHAT IS CONSTRAINING ALTERNATIVE POWERTRAINS?
What, then, is holding back faster adoption of alternative powertrains? How might policymakers, manufacturers, and distributors accelerate the powertrain transition? Our study asked participants what their pure (excluding hybrid) powertrain preferences would be in a hypothetical world where total lifecycle costs across the vehicle’s lifetime are equal (see Figure 14). In this case, just 14% of respondents would stick to an ICE vehicle, 48% would choose a BEV, and 16% would choose hydrogen-powered, with the remaining 16% indifferent.
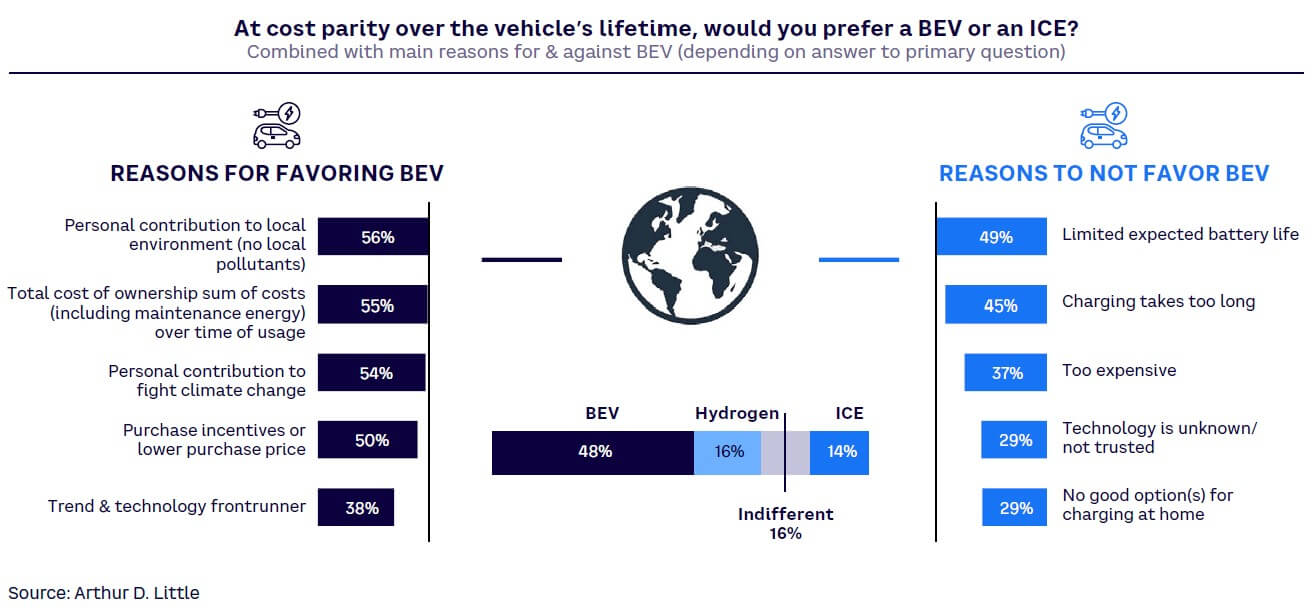
Despite this willingness to change, 44% of ICE drivers globally still plan to continue driving ICE vehicles, a figure that is higher in the US (65%). Why is this? The main issues are perceived cost, battery life, and EV range:
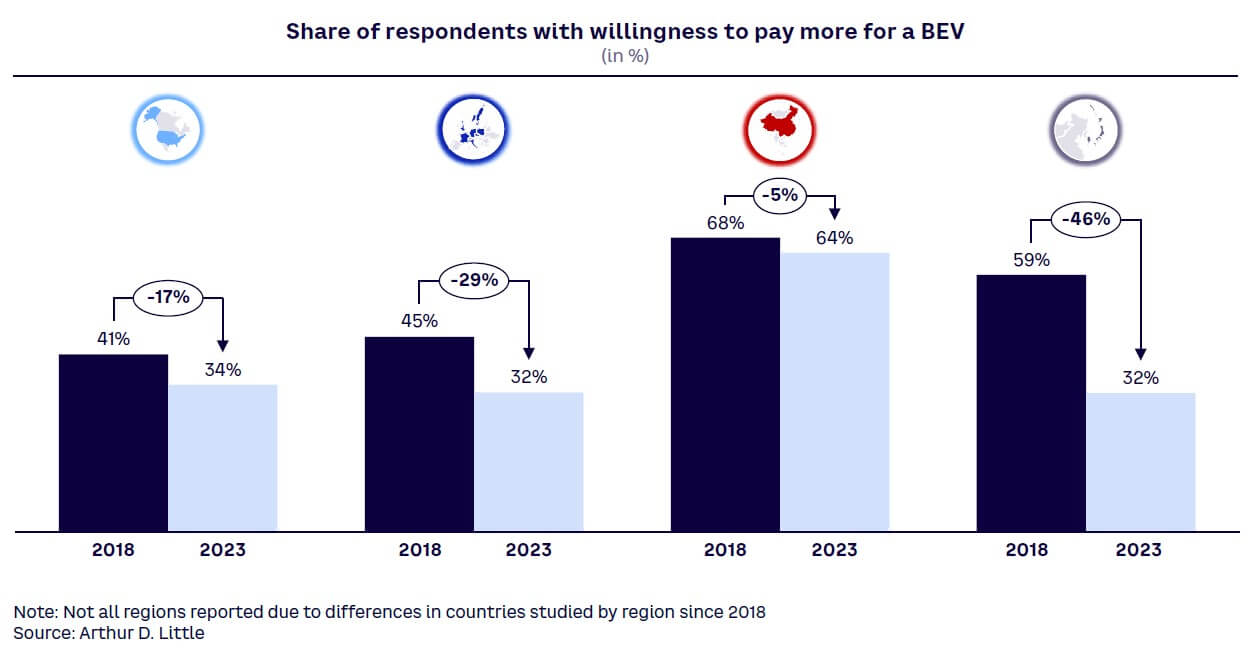
- Perceived cost. The willingness to pay a premium for BEV has decreased everywhere over the past five years (see Figure 15) with the most significant drop in Northeast Asia (by 46% to 32%) and the smallest in China, where it has only fallen by 5% (to 64%). Current price cuts by BEV manufacturers and the rising availability of cheaper Chinese EVs support customer expectations that prices will continue to decrease.
This could have positive or negative effects — inspiring increased EV switching or leading customers to hold off believing that prices will drop further. Beyond actual cost, it is also notoriously difficult for users to estimate total cost of ownership (TCO). Because many drivers have not experienced owning an EV, they’re unaware that EVs are already TCO-advantaged in many regions and for many usage patterns. Comprehensive leasing offers (including maintenance and even electricity) will make TCO advantages increasingly transparent. - Battery life. Almost half (49%) of those not choosing a BEV as their next vehicle state battery life as the reason. This is backed up by related concerns, including time to charge (45%), a lack of good home charging options (29%), and untrusted technology (29%). However, these concerns are being overcome through technological progress. For example, the last 10 years have seen dramatic improvements in driving range and charging times.
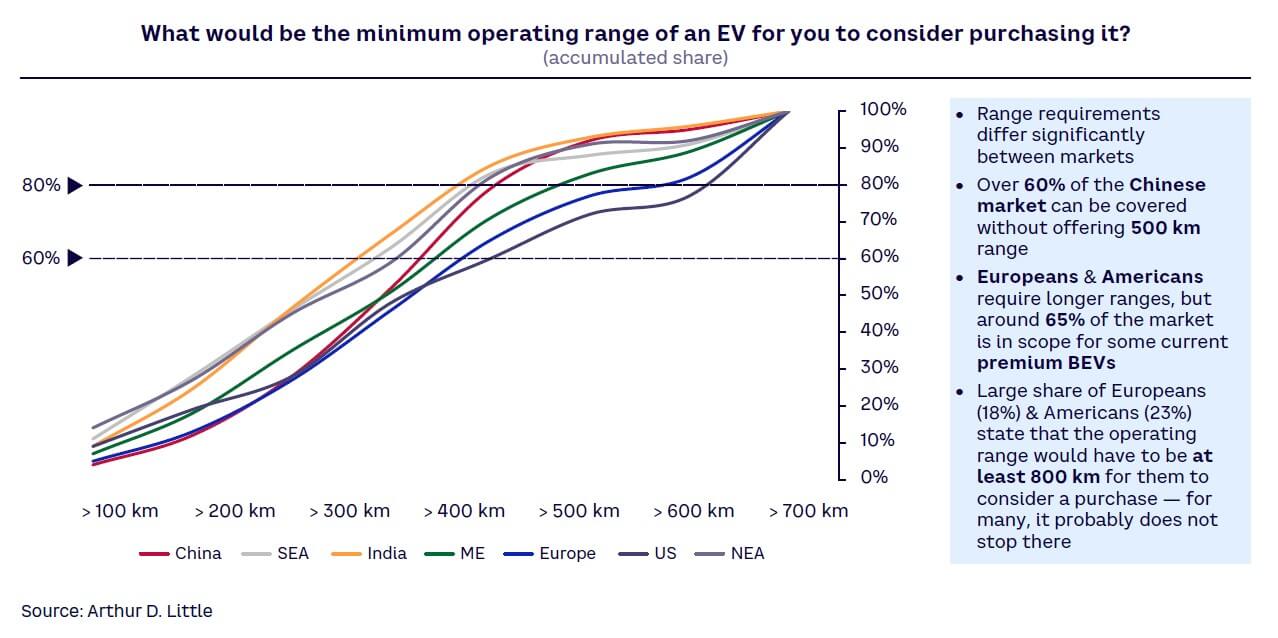
- Range requirements. The ideal range that drivers want from EVs differs significantly between regions, with anything from 450 km to 750 km needed to convert 80% of users (see Figure 16). In Europe and the US, customers consistently state that they require long ranges from a battery, despite figures that show they drive significantly shorter distances on average. Nearly a quarter of US drivers (23%) and 18% of Europeans want a range of 750 km or more! By contrast, over 60% of Chinese market needs can be covered by a range of up to 500 km. Around two-thirds of the European and US markets have requirements that can be met by current premium BEVs — while a range of 600 km will help to address 75% or more of the market, even in long-range environments like the US. Increasing range will either require better batteries, higher vehicle efficiency, or a change in user behavior. With more people gaining actual EV experience, the range requirements are expected to drop in Europe and the US — smaller batteries will also help fulfill the promise of more affordable EVs for those markets.
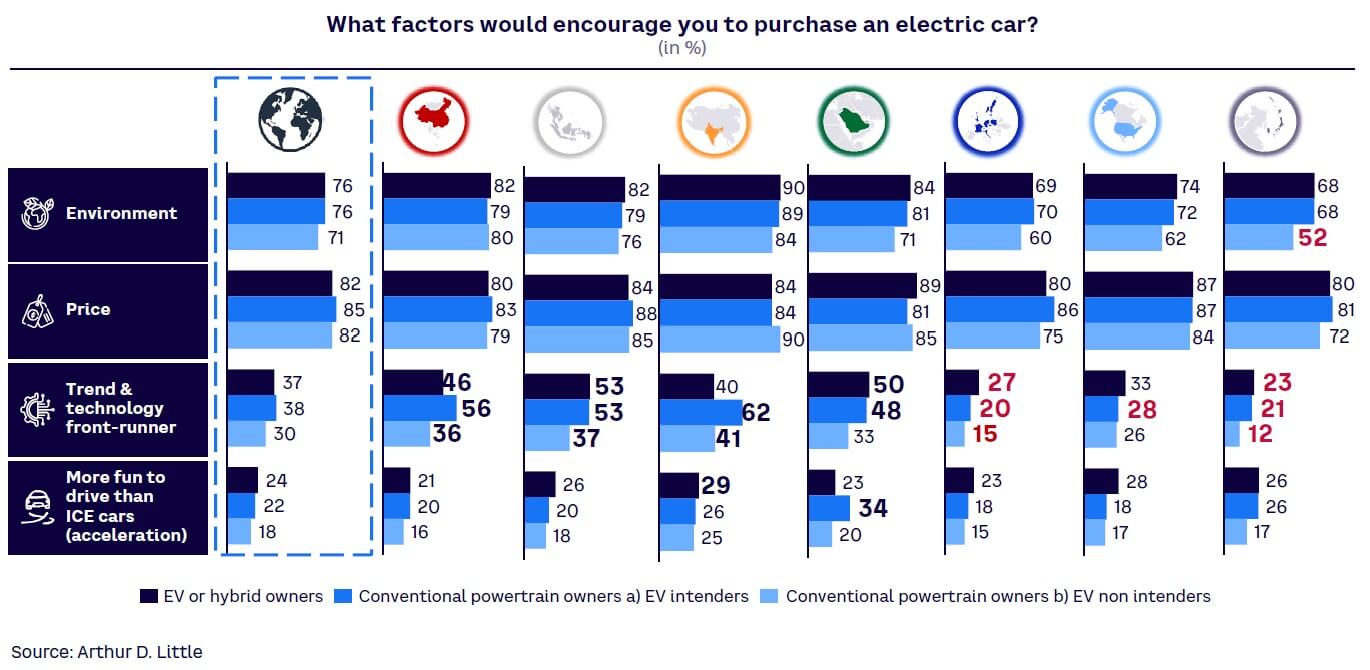
Another look at the research shows several reasons for purchasing BEVs with similar scores, including personal impact on the environment and climate change, TCO, and purchase incentives. Overall, the highest factors affecting EV purchase across all drivetrain groups are linked to cost (price and TCO), ahead of environmental concerns (see Figure 17).
BEVs & BRAND LOYALTY: THE RISE OF CHINA
Shopping for a BEV may prompt customers to reconsider the different options and brands available to them, potentially reducing brand loyalty built up over many years in the ICE world. Globally, 19% of existing owners of premium brand models[5] say they would be more likely to switch, compared to 17% of those who own volume brand vehicles. This shift is highest in India (58% premium and 42% volume) and lowest in Europe (9% premium and 8% volume) and the US volume market (3%). However, the US premium market is being and will continue to be disrupted, with over a quarter (28%) more likely to change.
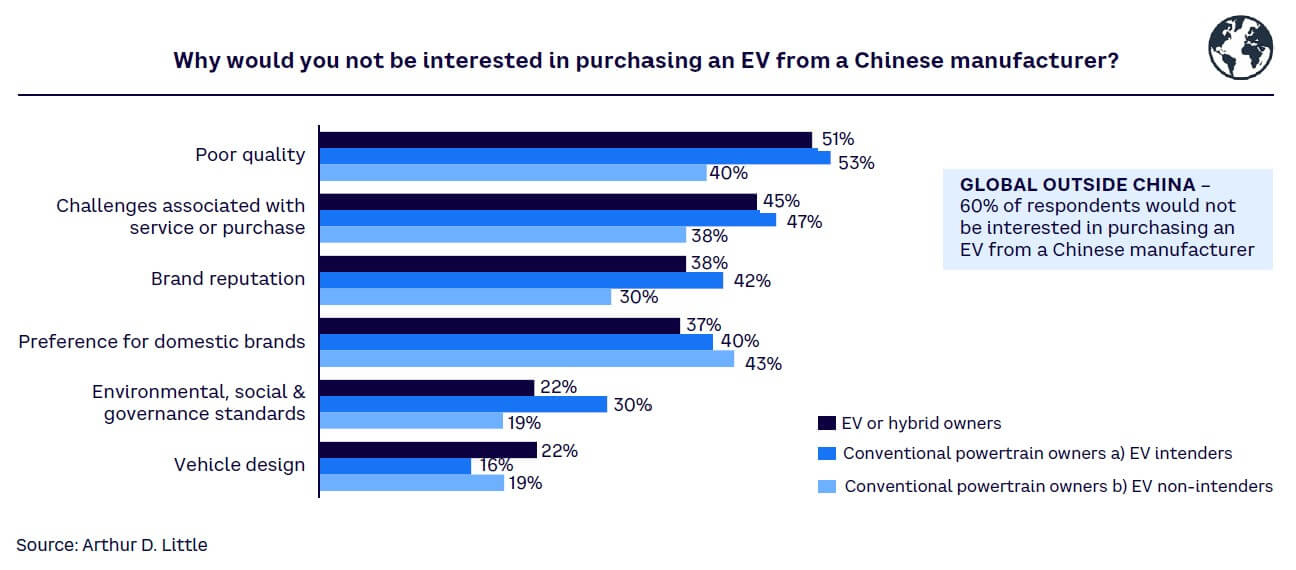
Chinese EV manufacturers are rapidly growing in terms of global presence. Their rising visibility (and lower prices) leads to potential tariffs and regulatory action in Europe and the US, including exclusion from some European national incentive programs, due to low content of European components. However, outside China more than half (60%) of respondents say they were not interested in purchasing a Chinese EV (see Figure 18), naming perception of quality and customer sales/service experience as the main reasons.
ATTITUDES TOWARD EV CHARGING
Forty-five percent of respondents cite charging time as one of the key reasons for not buying a BEV; this is linked to the largest concern of limited range, highlighted by 49% of respondents (refer back to Figure 14). To overcome these issues, it is important to understand customer needs and attitudes to ensure the right charging infrastructure is available in the right locations.
Location of EV charging facilities
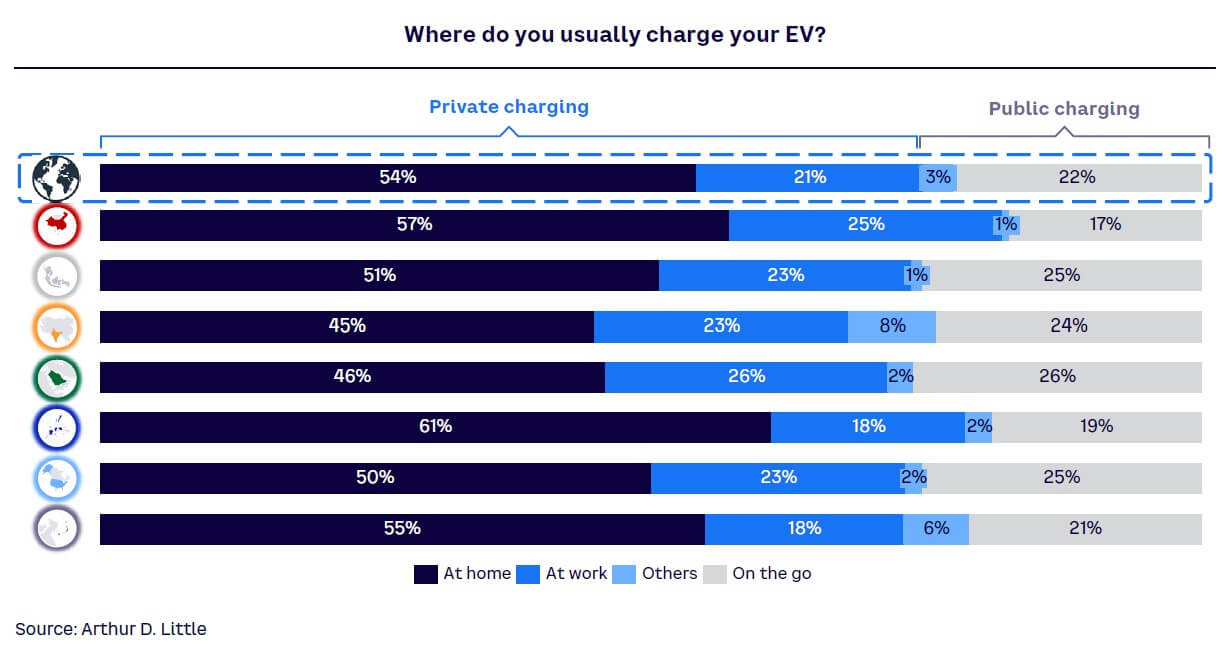
Home charging is the most important use case, making up over half of EV charging (see Figure 19), with very similar patterns across regions. Home charging is dominant because it fits most requirements — people have commutes well under the vehicle’s driving range, so they do not need to charge away from home, and it is far more convenient (e.g., overnight charging) and typically cheaper than public alternatives, unless free charging is available at the driver’s destination. However, those living in multi-occupancy dwellings in large cities may not have access to home charging.
The positive news is that when they do use public charging, users are generally satisfied with the experience (see Figure 20).
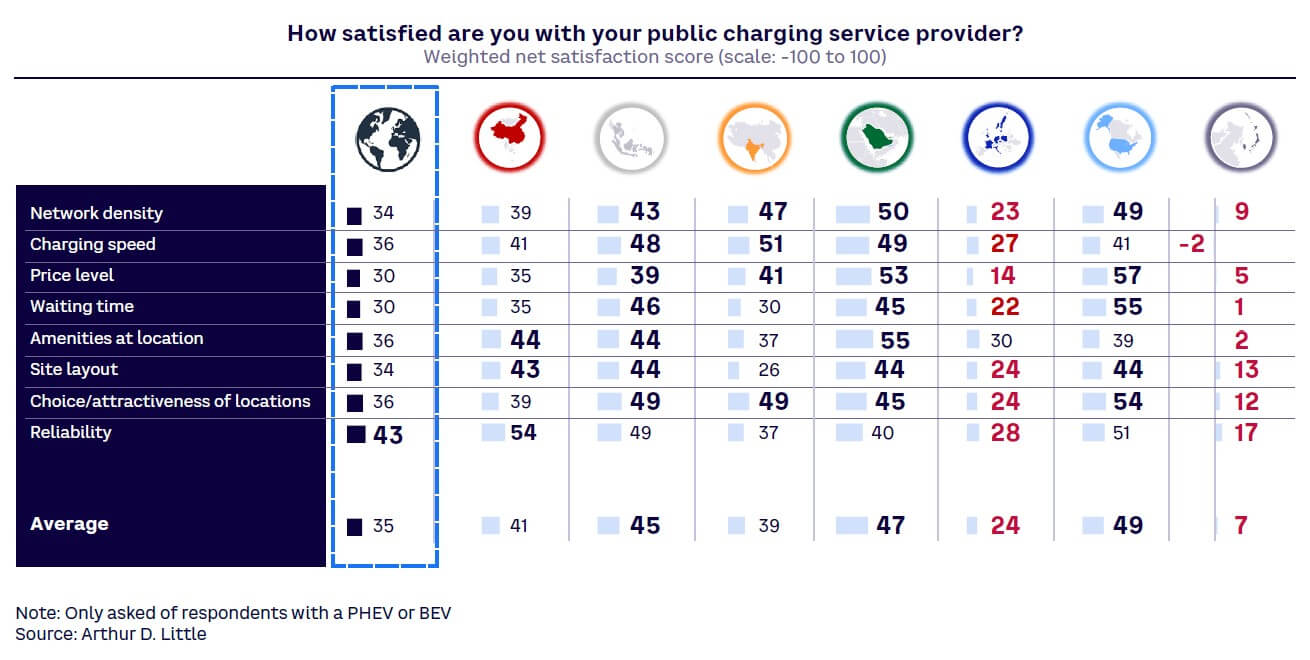
Globally, public charging has a +35 net satisfaction score among EV owners, similar to what research revealed in 2021 when there were fewer EVs on the roads. The lowest (but still net-positive) satisfaction is in Northeast Asia, where it scores +7, with charging speed and waiting time the biggest issues. In Europe, price (with our survey undertaken at a time of high electricity prices) and waiting time are the biggest issues. EV drivers in the US are the most satisfied with public charging (+49), likely linked to the charging network provided by Tesla, which sells over half of the EVs in the US market.
When choosing a public fast charger, the most important criteria are convenience (proximity, short waiting times) and charging speed. Globally, 56% of respondents cite proximity, 53% charging speed, and 50% certainty of no waiting time as the most important factors when choosing a charging location. While these factors are consistent across regions, preferred payment methods vary:
- Credit cards are the number one choice in Northeast Asia (59%), Europe (55%), and the US (52%).
- App payment is preferred in China (54%) and Southeast Asia (42%).
- The global average split for payment methods is 37% bank credit card, 33% app, 21% charge card/mobility service provider, and 9% plug and charge, where charge points automatically exchange data with the car via the charging cable to authorize charging.
5
DIGITAL’S IMPACT ON SALES MODELS
The automotive industry’s traditional distribution model is via third-party retailers (“dealers”). This approach is expensive; distribution costs (excluding customer discounts) make up 15%-20% of a new vehicle’s price for a B2C sale, while also preventing OEMs from having a direct relationship with their retail customers. Digitalization in the channel has been addressing these two challenges (cost and relationship) over the past 15 years. In particular, the search and configuration stages have progressively moved online during this period, while many OEMs are selling a small share of their vehicles directly to retail customers through their websites. So how are attitudes changing when it comes to buying cars online via digital channels?
BUYING ONLINE
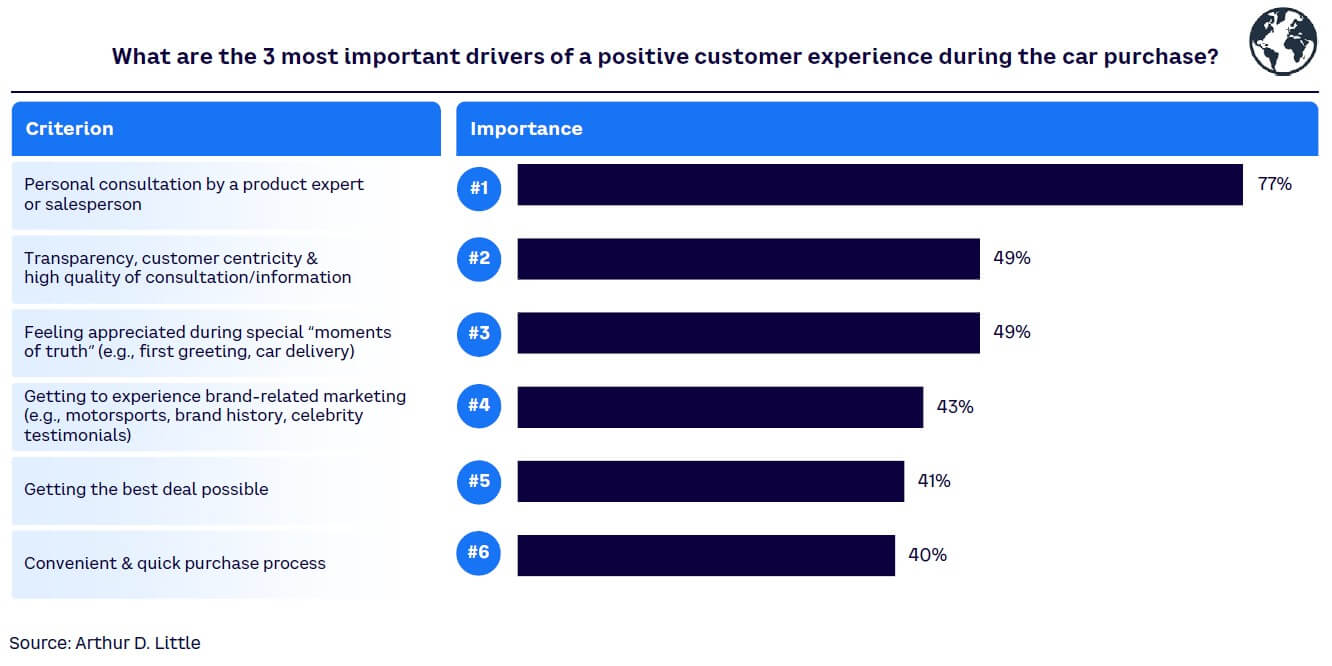
Customers overwhelmingly value personal consultation during the automotive purchase process, with over three-quarters (77%) naming it as the number one factor driving satisfaction (see Figure 21). The personal touch is particularly important if a car is being bought outright, rather than leased or rented, given the large sums of money involved. This factor is followed by transparency and customer-centricity/feeling appreciated (both scoring 49%), with a convenient purchase process ranked as the sixth most important reason (40%).
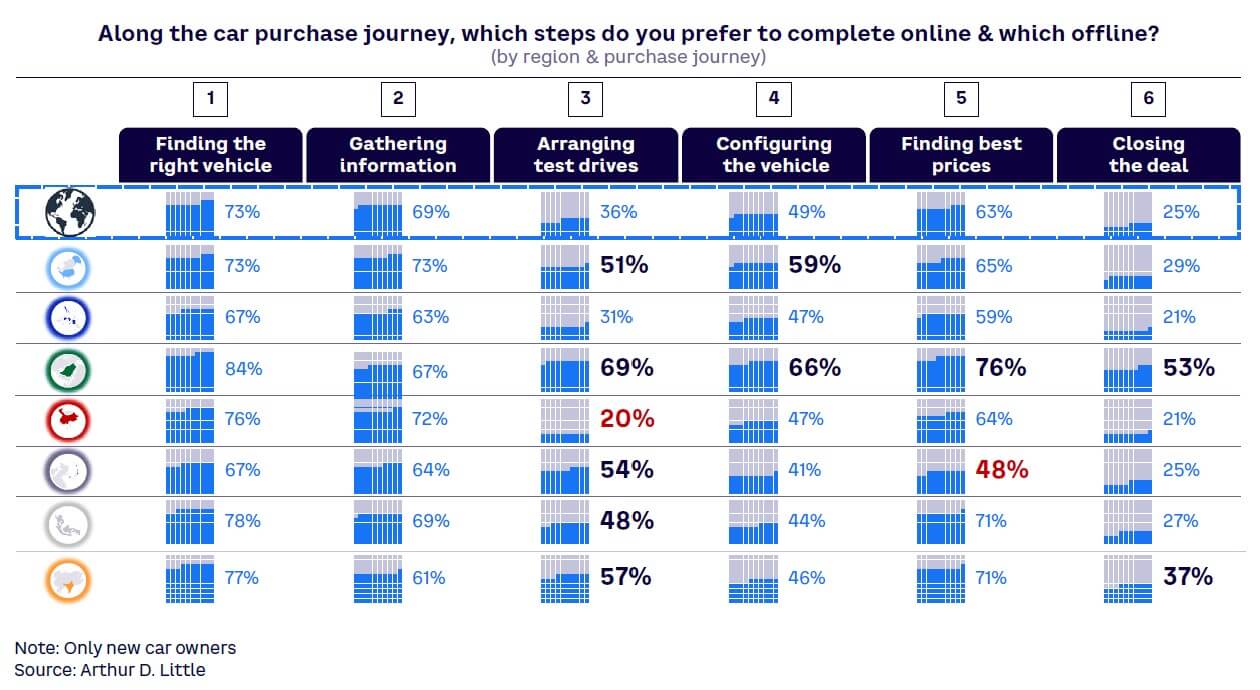
This strong customer preference for personal attention limits the use of digital tools to the top of the sales funnel (search, information, configuration, pricing), as shown in Figure 22. The middle and bottom of the funnel, covering activities such as test driving and deal closing, remain mostly in-person — just 25% of global respondents said they were happy to close the deal online. There are regional variations, with participants in the Middle East (53%) and India (37%) the most open to digital transactions.
Age is again important, with digital natives, aged between 30 to 44, the most open to buying their next car online; respondents under 30 are also broadly positive. With the exception of digital-friendly China, older groups still strongly prefer traditional, physical sales models.
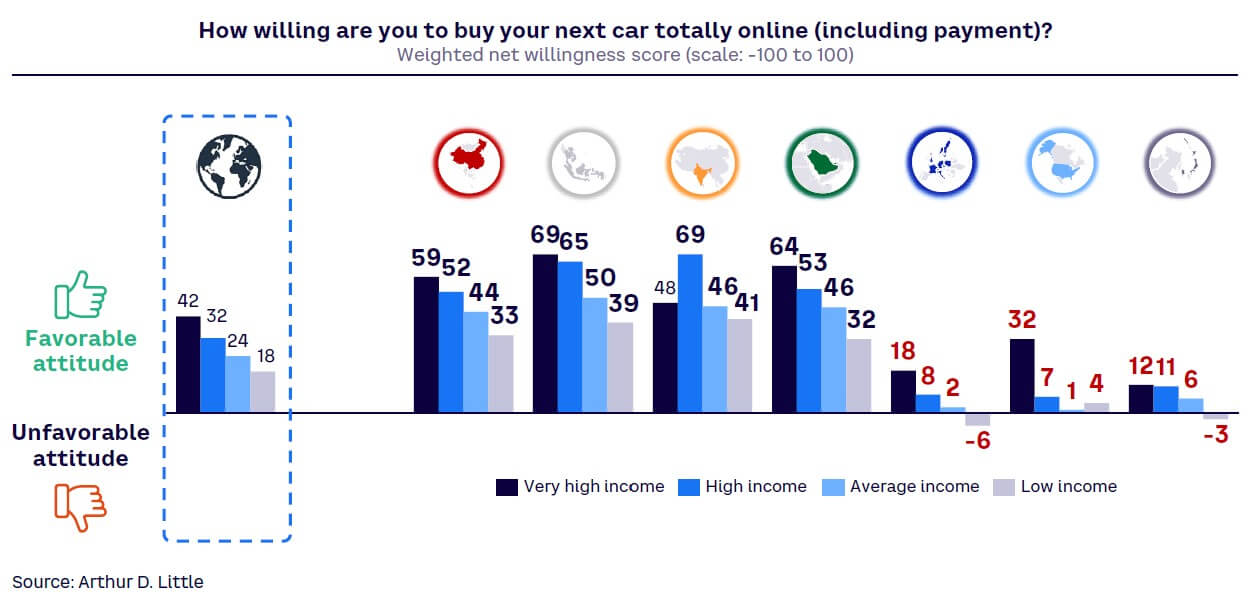
Across all regions, the higher the income, the greater the willingness of respondents to buy their next car totally online, including making the final payment (see Figure 23). This income effect split is strongest in Southeast Asia (30-point difference in favorability between very high incomes and low incomes) and the Middle East (32-point difference). By contrast, few among even the highest earners in Europe and Northeast Asia view buying totally online favorably, while the lowest income groups see it negatively.
WHAT DO BUYERS WANT FROM ONLINE PURCHASING PROCESS?
To drive online sales, OEMs and their dealers need to understand both positive and negative customer views around online purchasing. When asked what they saw as the benefits of buying online, respondents overwhelmingly picked “no pricing games” (86%) ahead of speed/convenience (68%). Essentially, buyers want to feel that they have secured a fair deal, and they believe that the transparency of online channels helps deliver this. Perceived benefits vary between income levels; 61% of lower earners prioritize lower prices when buying online, while 70% of high-income groups see the “faster/more convenient process” as the major advantage.
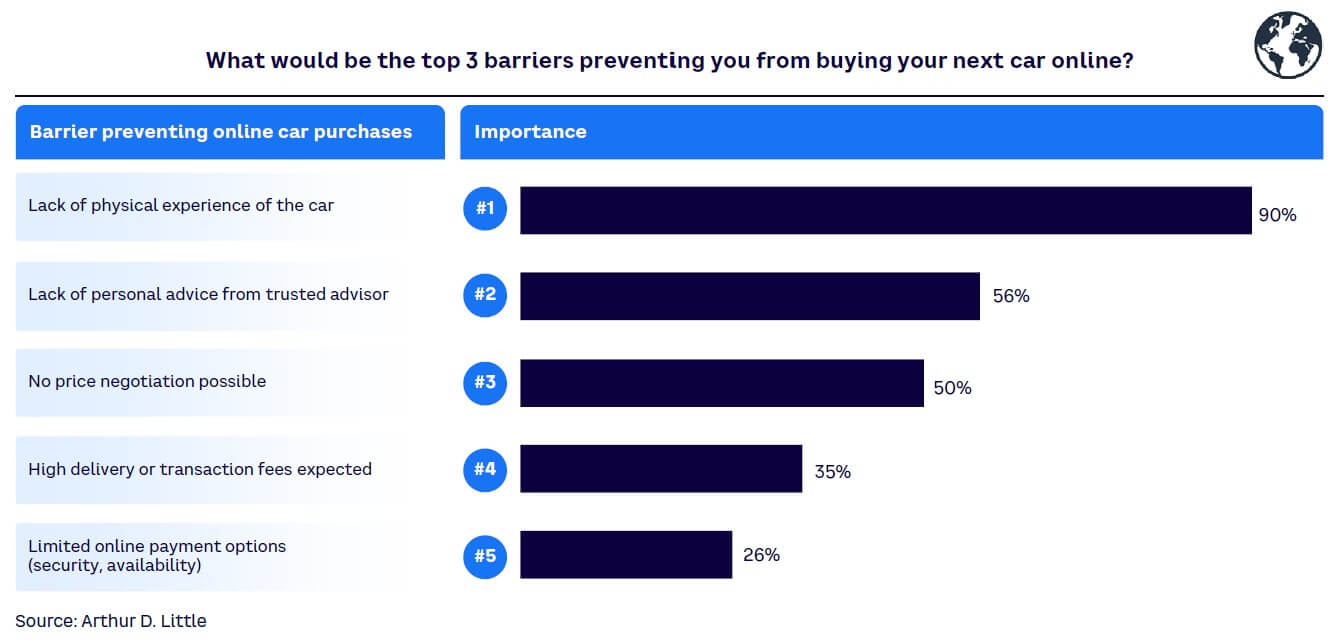
The biggest barrier to buying online is that customers want to literally kick the physical tires of the vehicle they are purchasing (cited by nine out of 10 respondents) and gain personal advice (56%) — see Figure 24.
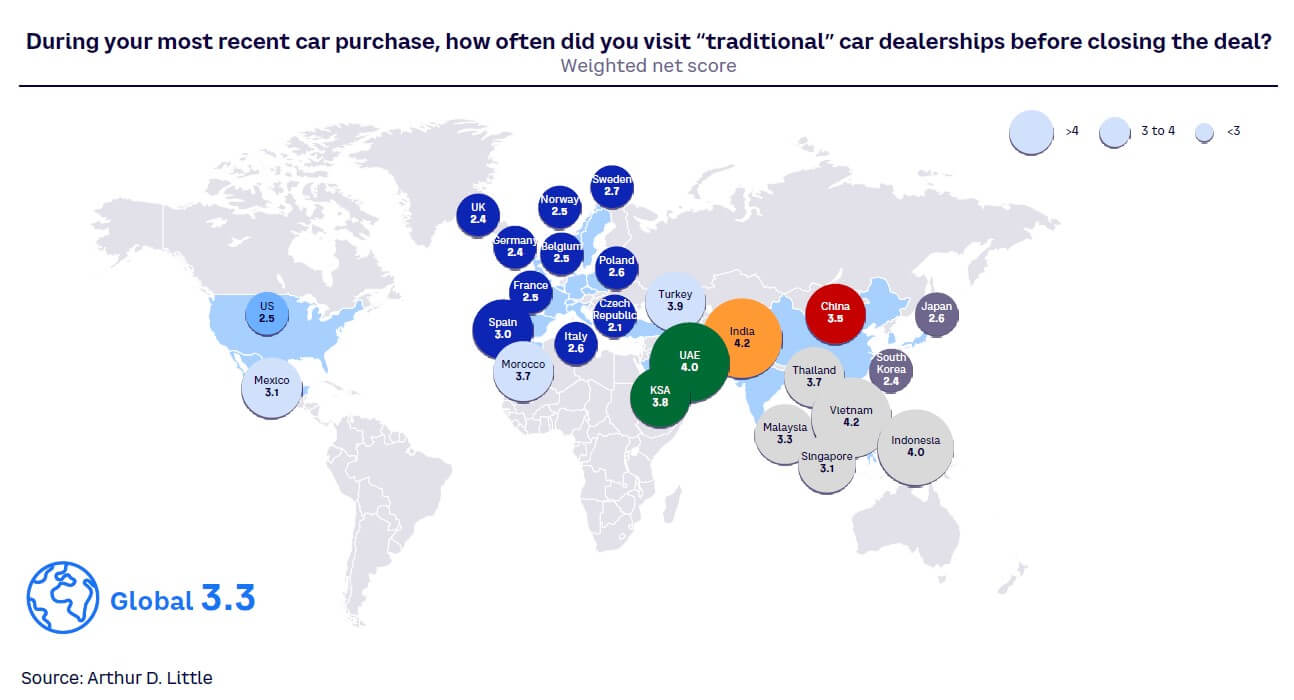
Backing up this desire to physically experience the car, the preferred test-drive location for more than half (55%) of respondents globally is at the dealership. Depending on the region, the number of visits to the dealership varies. While the global average is 3.3 (see Figure 25), in higher-income countries this falls to two to three trips and rises to three to four visits in average-income countries. This points to a need to offer buyers additional reassurance in these markets to streamline the process and get the sale over the line.
CONCLUSION: STEERING AWAY FROM “CASE”
The “Future of Automotive Mobility 2024” Report moves us beyond CASE as a framework to understand industry development. While connected is a given and the electric transition is irrevocably (if unevenly) underway, autonomy is not trusted by customers and sharing cars with others is neither economically viable nor popular outside ride hailing (taxi) services.
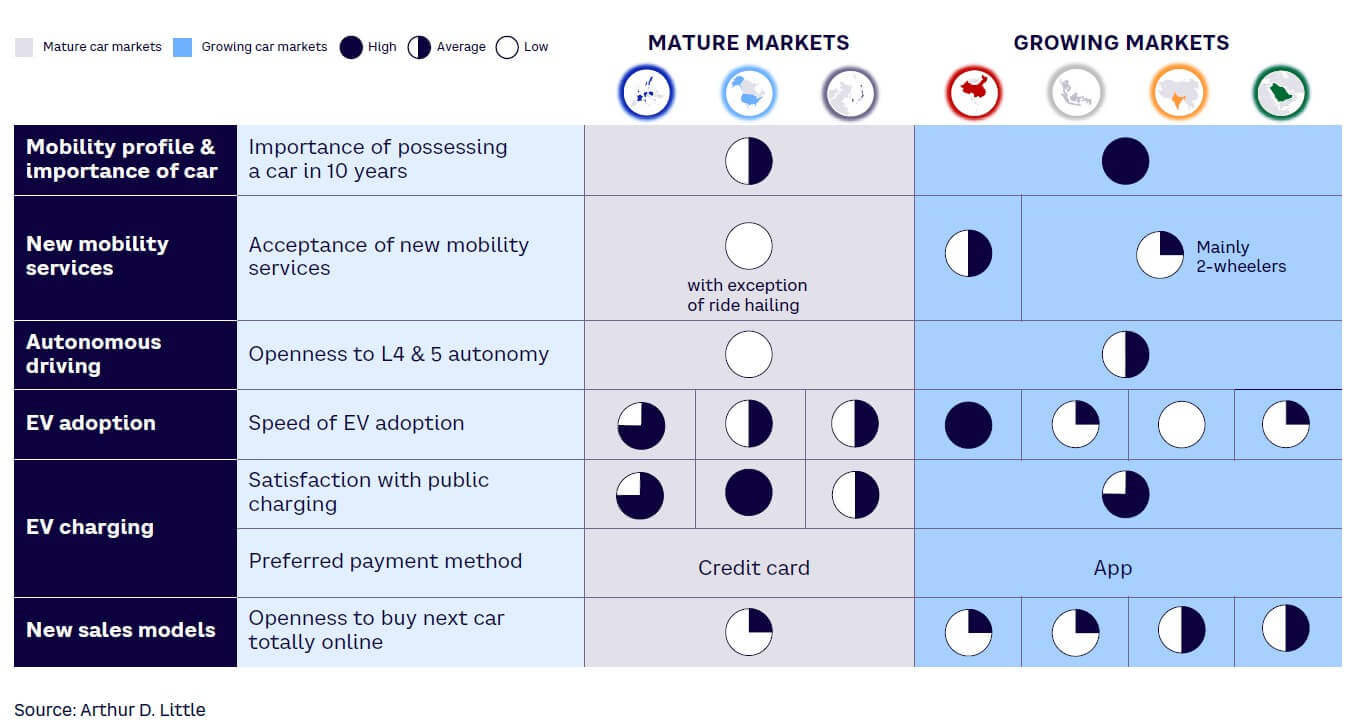
As Figure 26 shows, regional differences cover all aspects of mobility, from the importance of car ownership to sales models, and must be understood and acted upon to deliver what specific markets require.
Cutting across this, different income groups have specific preferences and requirements that need to be met, and OEMs must cater to the varying attitudes of BEV owners/intenders and ICE loyalists.
Our experience, combined with the research, uncovered multiple opportunities:
- Mobility by car, independent from public transport networks, timetables, or the availability of shared mobility options, is still the preferred travel option for most respondents. Customers in emerging economies still aspire to increased private motorization. The center of gravity in the global automotive industry will further shift to those regions.
- Rather than being a short-term bridge to EVs, hybrids (PHEV and HEV) will remain a powertrain alternative for the near future. Manufacturers should look to cater to the needs of those looking to electrify their mobility while overcoming range anxiety.
- Electrification will continue, but progress will not be linear across the globe. Manufacturers need to select their target markets and customers wisely to prevent wasted efforts and lost sales. The key challenge in most markets outside of China is still to convince the mainstream customer to transition away from ICE vehicles.
- Automated driving, where technology assists the driver, is popular in many markets, but safety fears are holding back adoption of technologies beyond L3 in regions such as Europe and the US. OEMs should tailor their offerings accordingly and focus on automation that drives value for customers.
- Customers are increasingly open to sales digitalization, but this needs to work effectively with physical points of sale at key points of the customer journey (e.g., test drives). Whether these points of sale are operated by the OEM or independent retailers does not make a difference to the buyer; providing quality human interaction is what’s important.
Notes
[1] ADL has highlighted the underlying causes, together with the potential role of car sharing within the broader ecosystem, in the recent Report “Sharing in Success.”
[2] For all figures in this Report, values are weighted by country car sales.
[3] Van Audenhove, François-Joseph, et al. ”Future of Mobility 3.0: Reinventing Mobility in the Era of Disruption and Creativity.” Arthur D. Little, March 2018.
[4] “Global EV Outlook 2024.” International Energy Agency (IEA), April 2024.
[5] Premium brands include: Volvo, Audi, BMW, Jaguar, Tesla, Lexus, Cadillac, Mercedes, and Nio; volume brands include: Citroën, Fiat, Ford, Hyundai, Jeep, Kia, Nissan, Opel, Peugeot, Renault, SEAT, Skoda, Toyota, Volkswagen, and BYD.
DOWNLOAD THE FULL REPORT
28 min read • Automotive
The future of automotive mobility, 2024
The CASE paradigm confronts reality
DATE
FOREWORD
This fourth edition of the Arthur D. Little (ADL) “Future of Automotive Mobility” global end-user study builds upon previous editions to deliver insights based on extensive primary customer research. First conducted in 2015, the study identifies disruptions and trends for the future, providing the intelligence that industry actors need to meet changing customer requirements in different parts of the world. For this edition, we analyzed a sample of over 16,000 users from an unprecedented 25 countries, which collectively accounts for over 80% of global new car registrations.
Our research shows that the simple view of unidirectional progress toward a connected, autonomous, shared, and electric (CASE) world is increasingly untenable, as both producers and consumers reassess costs and benefits; it also confirms trends identified in previous editions of this study. The immediate world of automotive mobility will be connected, assisted (not autonomous), private, and in a protracted transition to electric.
Moreover, we see significant and increasing divergence between the mature markets of the US, Europe, and North Asia, which are at peak motorization, and the more dynamic, yet price-sensitive, markets of the rest of Asia and the Middle East.
Richard Parkin
Partner
Automotive and Growth Practices
EXECUTIVE SUMMARY
POWERING THROUGH CURRENT AUTOMOTIVE CHALLENGES
During the early 2000s, many automotive industry commentators predicted that we would be well on our way by now to living and driving in a CASE world.
A tap on our smartphone screen would summon a zero-emission, driverless vehicle to our door, ready to whisk us to our destination in comfort, with connected apps keeping us in constant touch with the world around us. At the end of our journey, the vehicle would glide away to its next passenger, leaving us free from worries about ownership, maintenance, and parking.
However, previous editions of the “Future of Automotive Mobility” study, along with the actions of OEMs, confirm that expectations of a CASE future have not yet universally translated into reality. While cars are now connected and well on the way to being electric, they are assisted rather than autonomous and remain individual (or private) rather than shared. The industry increasingly recognizes this: launch dates for fully autonomous vehicles have been pushed back or canceled, and strategies are shifting from full autonomy to promoting advanced assisted driving.
This edition of the study addresses the following five topics:
- User mobility profiles and car ownership
- New mobility services
- Autonomous driving
- Alternative drivetrains, including electric vehicles (EVs), and charging infrastructure
- The impact of digital tools on sales models
Based on our analysis, the sector needs to act on four key challenges, in particular:
- Drivers must be convinced to embrace more sustainable motoring and move from internal combustion engine (ICE) vehicles to meet requirements to reduce still-increasing transport carbon dioxide (CO2) emissions. This change is not only critical for achieving decarbonization; it also delivers returns on the growing investment made by the industry in transitional hybrid and battery electric vehicle (BEV) technologies.
- Companies must meet regulatory challenges linked to decarbonization, such as tightened emissions regulations, which include low emissions zones and bans on the sale of ICE vehicles, while ensuring they reap the financial benefits of government incentives, such as the US Inflation Reduction Act (IRA). At the same time, they must navigate growing geopolitical rivalries between the US, Europe, and China, which affect operations, especially global supply chains.
- Existing manufacturers need to address the impact of new disruptors, such as Chinese EV-native OEMs joining the likes of Tesla to increase competition and decrease brand loyalty, which intensifies pressure on pricing and speed of innovation.
- Both manufacturers and retailers must continue to digitize their sales operations to ensure that customers can move between digital and physical purchasing options according to their preferences. While massive strides have been made with products (e.g., connected cars and software architecture), opportunities remain in terms of sales channels and customer experience. Understanding the customer dimension is central to setting the right strategy.
CASE MEETS REALITY
Revaluating the journey
For the past 15 years, the automotive industry’s future has been framed around the concept of CASE:
- Connected. Fully digital, connected vehicles constantly share data to enable new services, including entertainment, safety, navigation, fuel efficiency, and maintenance.
- Autonomous. Level 4 (L4) and Level 5 (L5, high driving automation/full driving automation) vehicles operate with a high degree of autonomy and are essentially self-driving.
- Shared. On-demand, shared models increasingly replace individual car ownership, reducing costs for users through increased asset utilization and opening new revenue streams for OEMs.
- Electric. Electric powertrains become dominant, replacing ICE vehicles to reduce emissions and transform the driving experience.
How far down the road to CASE are we? Combining our global customer research with other sources shows a picture that is substantially different from the one we expected just a few years ago:
- Connected. While this has become the standard in areas such as navigation, entertainment, safety, maintenance, and service, the connected interface is often the owner’s smartphone rather than the connected services offered by the manufacturer.
- Autonomous. There is limited customer interest in higher-level L4/L5 autonomy, due to ongoing safety concerns. L2/L3 (partial driving automation/conditional driving automation) delivers the benefits that most customers want, without requiring changes to the regulatory environment needed for L4/L5. At the same time, OEMs have advanced far less on autonomy than originally planned, primarily due to other demands on capital, such as creating new software architectures and developing EVs.
- Shared. Car sharing, while growing, remains at only 3% of the global shared mobility market (US $3 billion of a $100 billion market). It has failed to take off as operator after operator has struggled to develop a viable business model, primarily due to low utilization and high changeover costs between drivers. Moreover, car OEMs have progressively exited the business.[1] Ride hailing via digital apps has instead seen the fastest growth and heaviest use. For all the talk of widespread de-motorization, this change remains limited to wealthy, Western, urban areas where high-quality public transport is in place.
- Electric. BEV is becoming the mainstream technology, as battery costs decline and range increases while infrastructure continues to improve. Northern Europe (Norway and the Netherlands) and China lead BEV adoption. However, there are significant numbers of ICE holdouts, especially in the US, and many customers are choosing hybrids over pure EVs.
Navigating the future
Uneven progress toward CASE points to the challenges the automotive industry faces now and in the future. In addition to making investments to electrify powertrains and redefine vehicle software architectures, it must cope with disruption by new entrants, heightened sustainability pressures, and changing customer needs. These considerations are set against the backdrop of tightening regulations, geopolitical turbulence, and potential national and regional tariffs on an industry that strives to operate globally.
1
MOBILITY PROFILE & CAR OWNERSHIP
MOTORIZATION IS ACTUALLY GROWING
Despite earlier predictions that the importance of car ownership car will decrease, the number of vehicles on the world’s roads is growing, not shrinking. Globally, users believe that having their own vehicle will be equally or more important in 10 years’ time (see Figure 1[2]) compared to today. This outlook is driven by three trends:
- Large-scale increases in car ownership in developing markets, due to economic growth. The traditional S-curve relationship between GDP per capita and cars per household continues to hold, with rapid growth in car ownership above $5,000 GDP per capita, reaching a plateau at average annual incomes above $20,000 per capita (see Figure 2).
While no single variable alone can explain motorization rates (population density, public transportation availability, and income distribution, among others, play a role), real GDP growth is the number one factor by far. - Greater reliance on cars, as people age and their living conditions and mobility needs entail shifts in preferences (see Figure 3).
- Car ownership as a necessity, where it is the cheapest and/or easiest form of mobility; for example, in the US, mostly low-income groups report that they would not give up their cars, while those in rural communities and smaller towns drive the furthest on average per year. These elements of spatial structure and public transportation infrastructure explain the different levels of the plateau (e.g., 0.7 cars per capita in the US versus 0.4 to 0.6 in most Organisation for Economic Co-operation and Development [OECD] countries).
Among our sample, expectation of de-motorization is not widespread; it is limited to Western Europe and densely populated areas in Asia (e.g., Singapore and Hong Kong). Expected de-motorization is essentially a wealthy, urban phenomenon, with high-quality public transportation a prerequisite. Three-quarters (76%) of those in European cities with a population of over 5 million are prepared to give up their car, compared to 62% in towns with under 250,000 people. ADL’s “Future of Mobility” city ranking[3] is led by cities such as Singapore, Stockholm, Amsterdam, and Copenhagen, which have highly mature, cost-effective public transport and strong support for alternative mobility types like cycling.
Relatedly, there is an inverse correlation between city size and car usage. In cities with over 250,000 inhabitants, around half of respondents drive under 6,000 km a year. In smaller towns and suburban environments (under 250,000), people who drive between 6,000 and 15,000 km are the majority. Two-thirds (67%) of those in towns with a population of under 10,000 drive over 6,000 km each year.
Young people expect the importance of having a car to be higher in 10 years, even in mature markets such as Europe and North America. Only the older age group (over 45) in Europe and North America expect to de-motorize as they age (refer back to Figure 3).
WHAT DO DRIVERS WANT IN THEIR NEXT CAR?
When deciding on their next vehicle, customers in mature markets are much more likely to choose a used car compared to those in emerging regions, such as China and India (see Figure 4). This is partly aspirational in terms of a desire to own a new vehicle but is also due to the availability of quality used vehicles. Mature markets have a plentiful supply of a broad range of used cars, often sourced from a well-developed leasing market and backed by a trusted used vehicle distribution brand. These conditions drive higher trust in the quality of used vehicles and in used car sales channels.
2
NEW MOBILITY SERVICES
There is no general trend away from car ownership or toward shared transportation visible in our data. The study shows a lack of interest in giving up personal car ownership, as it is still considered essential for many, particularly in areas without good public transportation. Owning a car is also an aspiration for people under 45 as they move into middle age and for those in less-motorized parts of the world.
When asked what would persuade them to give up their personal car, respondents cited new, lower-cost mobility services (50%) and high availability of such services (38%). However, 28% would not consider giving up their car under any circumstances.
Among alternative mobility methods, traditional choices of public transport or ride hailing (which no longer only includes taxis) remain the most popular.
Car manufacturing is therefore not under threat from de-motorization in the vast majority of markets. However, tightening legislation and increasing urbanization could reduce car demand over the longer term. To increase their share of mobility and user numbers, public transport authorities and operators should focus on improving the availability and quality of the services they offer.
TRYING NEW SERVICES IS UNUSUAL
When it comes to experimenting with new services, China (up to 50%) and India (up to 45%) have the highest percentages of urban residents who have tried car and ride sharing. However, as shown in Figure 5, neither service is mainstream, as less than 50% of respondents have tried them. Traditional public transport remains strong, especially in Europe and China.
In fact, the most often experienced new mobility service for urban respondents is ride hailing, tried by 50%-75% of people in every region or country except Europe and Northeast Asia. Globally, those in the 30-44 age range are the heaviest experimenters, with about 45% trying ride, car, or two-wheeler sharing, compared to only about 5% of people over 60 who have tried most service types (see Figure 6).
NEW MOBILITY SERVICES FOCUS ON RIDE HAILING
There are significant regional differences in the use of new mobility services, influenced by car ownership rates and access to reliable, comprehensive public transport. Urban dwellers in India, Southeast Asia, and the Middle East make an average of 14 to 17 journeys each month using new mobility services, compared to residents of Europe, the US, China, and Northeast Asia, who make dramatically fewer, between 11 and 12 (see Figure 7).
Globally, ride hailing usage occurs, on average, 3.5 times per month, with usage being higher in all parts of Asia and lower in the US (2.9 journeys) and Europe (2.3 journeys). Car sharing is the most popular new mobility service in the US, with users taking an average of 3.3 monthly journeys.
WHAT DRIVES ADOPTION OF NEW MOBILITY SERVICES?
When asked why they choose new mobility services, respondents listed flexibility (62%), cost (52%), and the environment (44%) as their top three reasons, as shown in Figure 8. Flexibility covers a range of areas — customers don’t need to own or maintain a vehicle, battle traffic in congested urban areas, or find parking; they can also switch easily between different transport modes. Flexibility is clearly the number one reason for using new mobility services everywhere outside Europe (where cost slightly outweighs it) and the US (where cost is almost as important as flexibility).
Income had a minor impact on the reasons for choosing new mobility services among urban respondents. However, cost unsurprisingly increased in importance for lower-income groups, while flexibility and environmental considerations decreased:
- Very-high-income groups — 66% cited flexibility as the key reason, 47% said cost, and 51% cited the environment.
- Low-income groups — 58% chose flexibility as a key factor, 55% cited cost, and 44% cited the environment.
When asked what changes to new mobility services would encourage people to give up their cars, the major areas respondents highlighted globally are cost (50%) and availability (44%). Twenty-eight percent would not give up their cars under any circumstances. There are significant regional differences: 77% of Chinese respondents require greater availability to replace their cars with mobility services; 75% of Indians cite improved ease of use; and nearly half (49%) of US respondents and 37% of those in Europe would not give up their car under any circumstances. Essentially, to increase the adoption of new mobility services, people require lower costs, higher availability, greater flexibility, improved reliability, and increased quality. This combination of requirements for higher service and lower cost typically makes the “shared” element of CASE unviable economically.
3
AUTONOMOUS DRIVING
Five years ago, the first L4/L5 production cars for private users were projected to be available by the second half of the decade, with rapid ramp-up thereafter. However, traditional OEMs have pushed their projects back, with new entrants such as Apple and Alphabet either downgrading or discontinuing long-term projects. OEMs and operators are now limited to piloting operations carried out under special permits and more controlled conditions.
WHAT DRIVES DIFFERENCES IN AUTONOMOUS ACCEPTANCE?
Despite technological progress and demonstrably improved safety over human-driven cars, the level of trust in autonomous driving technology has not significantly increased over the past five years, illustrating the lack of customer acceptance. In some geographic areas, trust has actually decreased, often due to well-publicized incidents and a failure by operators to effectively communicate its benefits. High-profile incidents in San Francisco, California, involving self-driving taxis run by Cruise and Waymo, with the vehicles crashing into fire trucks, striking pedestrians, and being vandalized by mobs, attracted a disproportionate amount of attention.
We see clear differences by income/location, with urban very-high-income and high-income respondents most positive on autonomous technologies (see Figure 9).
This correlation between income and acceptance of autonomous driving holds in all regions, though the threshold for acceptance varies. In China, we see 34% net approval at average income and city size between 1 and 5 million people, while in the US we need to move to cities with 5 million inhabitants and high incomes to see similar net approval levels.
European, Northeast Asian, and US respondents are the least willing to adopt autonomous vehicles, while those in India, China, and the Middle East demonstrate a much more favorable attitude (see Figure 10).
THE IMPORTANCE OF SAFETY TO ACCEPTANCE
Mirroring the examples cited above from California, the primary concern with autonomous driving across all incomes and regions is safety, encompassing both machine and human errors, as shown in Figure 11.
User concerns about safety mainly reflect the still-immature technology for L4/L5 autonomous driving and a resulting lack of positive experiences reported in the media. People are aware that current autonomous vehicles depend on backup human drivers who are ready to intervene, must go slower than a human driver, and only operate in dedicated environments with special infrastructure. The promised benefits of automation around convenience and ease of use have not materialized yet. On the contrary, recent incidents in the US, which led to pausing trials of the most advanced robo-taxis, coupled with high-profile stories on crashes of private vehicles, have not helped to increase customers’ confidence in the maturity of the technology.
However, if these safety fears could be overcome by positive user experiences, it would lead to greater usage of personal autonomous vehicles. When asked whether a fully autonomous car would increase or decrease their car usage, all respondents globally gave an average weighted score of +4, rising to +26 for those who were positive about autonomous driving. Again, this was highest in India, with a score of +32 for all respondents and +42 for those open to autonomous driving. This increased usage would replace:
- Existing personal non-autonomous vehicle (51%)
- Public transport (44%)
- Taxis (32%)
Overall, since 2015, the expectation of the percentage of public transport journeys potentially replaced with autonomous cars has grown, which would represent a switch from shared to personal mobility options.
4
ALTERNATIVE DRIVETRAINS & CHARGING INFRASTRUCTURE
New registrations of BEV and plug-in hybrid electric vehicles (PHEV) continue to grow across the world, reaching a high of 14 million in 2023, according to the International Energy Agency (IEA)[4] — 9.5 million BEV and 4.3 million PHEV. The total number of EVs on the road increased to 40 million (28.2 million BEV), which closely aligns with the sales forecast from the 2023 edition of the IEA “Global EV Outlook” (GEVO-2023). This represents a growth of 35% in new sales versus 2022. Moreover, this is more than six times higher than 2018 registrations. In 2023, there were over 250,000 new registrations per week, which is more than the annual total in 2013. Electric cars (PHEV and BEV) therefore accounted for around 18% of all cars sold in 2023, up from 14% in 2022, and only 2% in 2018. PHEVs and BEVs made up 38% of new car sales in China, 21% in Europe, and 10% in the US.
These trends indicate that growth remains robust as electric car markets mature. BEVs accounted for 70% of the electric car stock in 2023. However, multiple factors are affecting the pace of continued growth:
- Maturity in the most advanced markets, such as Norway, where over 80% of new registrations are BEVs, leaves little room for further growth.
- Government incentives for BEV purchases are being reduced or eliminated; in Germany, for example, the end of its subsidy program in 2023 led to a reduction in EV purchases of over 25%.
- Some vehicle segments, such as small and family cars, station wagons, and large SUVs are still not fully served by EVs.
- There is still uneven development of charging infrastructure.
The up-front price of EVs remains higher than their ICE counterparts in many markets, resulting in purchase hesitancy. These concerns are reinforced by the fact that residual values are hard to predict, with rapid changes in EV battery and charging technologies leading to worries about vehicle depreciation rates.
However, “fear of the new” is the most important barrier to EV adoption — most potential buyers have not yet experienced EVs and have prejudices and preconceptions about them. In the US, this effect is reinforced by the increasing politicization of discussions about vehicle powertrains.
WILL CUSTOMERS’ NEXT VEHICLES BE ELECTRIC?
Globally, nearly 90% of our respondents currently own a vehicle with an internal combustion engine, of which 73% are pure ICE, 11% are hybrids, and 6% are plug-in hybrids (see Figure 12). Nine percent of respondents currently have a pure battery EV. Figure 12 shows what these customers told us about their expected next vehicle. For example:
- ICE (without any electrification) is rapidly declining. 73% of the current sample are pure ICE, while only 34% of buyers expect to replace their current vehicle with a pure ICE car:
- 93% of these ICE purchases come from current ICE vehicle owners who plan to stick to their current powertrain.
- The remaining 7% comes from a small number of hybrid and EV owners returning to ICE.
- Many buyers seek the reassurance of a hybrid during the transition from ICE powertrains:
- 30% of current ICE buyers expect to go hybrid, with a smaller share (23%) switching directly to BEV.
- 45%-50% of existing PHEV and hybrid electric vehicles (HEV) buyers will stick with a type of hybrid.
- BEV owners are the most loyal, with 76% expecting to replace their BEV with another BEV, up from 62% when we first measured this in 2018.
Our research supports what we see in the registration numbers: there is a steady move toward BEV, often via hybrid. Yet there is a significant proportion of holdouts, and the numbers in any given market or month are conditioned by government incentives as well as manufacturers optimizing vehicle supply across markets and across time, often driven by threshold effects in regulations.
THE GEOGRAPHIC POWERTRAIN SPLIT
This trend away from ICE vehicles is least visible in the US. In that region, 86% of our sample currently have a pure ICE vehicle and over half (57%) intend to buy the same again, with 27% planning to switch to a hybrid option. Just 12% plan to buy a BEV. Although this means that potentially 43% of the vehicles in the US market will be powered by alternative powertrains, the majority will be hybrids.
In Europe, by contrast, the mix will shift from 82% ICE and 18% alternative powertrain to a 45/55 split based on purchase intentions. Forty-six percent of ICE drivers say they will choose an alternative drivetrain for their next vehicle, while 73% of existing BEV owners state that they will choose one again. However, as in the US, hybrids (HEV and PHEV) are the most common purchase intention, with 18% of respondents intending to choose an HEV, 14% a PHEV, and just 16% a BEV.
China will see the most rapid shift, with pure ICE volumes dropping from two-thirds (66%) of cars to under a quarter (24%), based on purchase intentions. This confirms the current trend of quick EV adoption among Chinese customers and a decreasing presence of ICE vehicles at motor shows in China. Among our sample, BEVs and all hybrids each represent approximately 35% of intentions.
These same trends are evident in the intended powertrain loyalty numbers (see Figure 13), with for example, high ICE loyalty (65%) in the US falling to only 36% in China; 45%-50% hybrid (HEV and PHEV) loyalty (with evidence of a move away from PHEV) in the US, and about 75% BEV loyalty, reaching as high as 80%, in China.
This year’s study demonstrates that BEV and hybrid powertrain vehicles are becoming mainstream across the world, with an increasing significance of purely electric powertrains. ICE sales volumes will drop, less loyal drivers will switch to alternatives, and those who currently own BEVs will buy a similar replacement, with their loyalty rising compared to previous studies. However, hybrids (both PHEV and HEV) will play a strong part in the move away from ICE, comprising about a third of sales. These findings demonstrate that hybrids, rather than being a short-term bridge from ICE to BEV, will play a larger, longer-term role in the powertrain shift. To facilitate the transition, OEMs should ensure that these hybrids provide sufficiently high pure-electric driving ranges to educate drivers about the potential of electric power while accelerating decarbonization.
This study suggests that combustion engines may still play a role for consumers in hybrid powertrains for years to come — if and where they are in line with emissions regulations.
WHAT IS CONSTRAINING ALTERNATIVE POWERTRAINS?
What, then, is holding back faster adoption of alternative powertrains? How might policymakers, manufacturers, and distributors accelerate the powertrain transition? Our study asked participants what their pure (excluding hybrid) powertrain preferences would be in a hypothetical world where total lifecycle costs across the vehicle’s lifetime are equal (see Figure 14). In this case, just 14% of respondents would stick to an ICE vehicle, 48% would choose a BEV, and 16% would choose hydrogen-powered, with the remaining 16% indifferent.
Despite this willingness to change, 44% of ICE drivers globally still plan to continue driving ICE vehicles, a figure that is higher in the US (65%). Why is this? The main issues are perceived cost, battery life, and EV range:
- Perceived cost. The willingness to pay a premium for BEV has decreased everywhere over the past five years (see Figure 15) with the most significant drop in Northeast Asia (by 46% to 32%) and the smallest in China, where it has only fallen by 5% (to 64%). Current price cuts by BEV manufacturers and the rising availability of cheaper Chinese EVs support customer expectations that prices will continue to decrease.
This could have positive or negative effects — inspiring increased EV switching or leading customers to hold off believing that prices will drop further. Beyond actual cost, it is also notoriously difficult for users to estimate total cost of ownership (TCO). Because many drivers have not experienced owning an EV, they’re unaware that EVs are already TCO-advantaged in many regions and for many usage patterns. Comprehensive leasing offers (including maintenance and even electricity) will make TCO advantages increasingly transparent. - Battery life. Almost half (49%) of those not choosing a BEV as their next vehicle state battery life as the reason. This is backed up by related concerns, including time to charge (45%), a lack of good home charging options (29%), and untrusted technology (29%). However, these concerns are being overcome through technological progress. For example, the last 10 years have seen dramatic improvements in driving range and charging times.
- Range requirements. The ideal range that drivers want from EVs differs significantly between regions, with anything from 450 km to 750 km needed to convert 80% of users (see Figure 16). In Europe and the US, customers consistently state that they require long ranges from a battery, despite figures that show they drive significantly shorter distances on average. Nearly a quarter of US drivers (23%) and 18% of Europeans want a range of 750 km or more! By contrast, over 60% of Chinese market needs can be covered by a range of up to 500 km. Around two-thirds of the European and US markets have requirements that can be met by current premium BEVs — while a range of 600 km will help to address 75% or more of the market, even in long-range environments like the US. Increasing range will either require better batteries, higher vehicle efficiency, or a change in user behavior. With more people gaining actual EV experience, the range requirements are expected to drop in Europe and the US — smaller batteries will also help fulfill the promise of more affordable EVs for those markets.
Another look at the research shows several reasons for purchasing BEVs with similar scores, including personal impact on the environment and climate change, TCO, and purchase incentives. Overall, the highest factors affecting EV purchase across all drivetrain groups are linked to cost (price and TCO), ahead of environmental concerns (see Figure 17).
BEVs & BRAND LOYALTY: THE RISE OF CHINA
Shopping for a BEV may prompt customers to reconsider the different options and brands available to them, potentially reducing brand loyalty built up over many years in the ICE world. Globally, 19% of existing owners of premium brand models[5] say they would be more likely to switch, compared to 17% of those who own volume brand vehicles. This shift is highest in India (58% premium and 42% volume) and lowest in Europe (9% premium and 8% volume) and the US volume market (3%). However, the US premium market is being and will continue to be disrupted, with over a quarter (28%) more likely to change.
Chinese EV manufacturers are rapidly growing in terms of global presence. Their rising visibility (and lower prices) leads to potential tariffs and regulatory action in Europe and the US, including exclusion from some European national incentive programs, due to low content of European components. However, outside China more than half (60%) of respondents say they were not interested in purchasing a Chinese EV (see Figure 18), naming perception of quality and customer sales/service experience as the main reasons.
ATTITUDES TOWARD EV CHARGING
Forty-five percent of respondents cite charging time as one of the key reasons for not buying a BEV; this is linked to the largest concern of limited range, highlighted by 49% of respondents (refer back to Figure 14). To overcome these issues, it is important to understand customer needs and attitudes to ensure the right charging infrastructure is available in the right locations.
Location of EV charging facilities
Home charging is the most important use case, making up over half of EV charging (see Figure 19), with very similar patterns across regions. Home charging is dominant because it fits most requirements — people have commutes well under the vehicle’s driving range, so they do not need to charge away from home, and it is far more convenient (e.g., overnight charging) and typically cheaper than public alternatives, unless free charging is available at the driver’s destination. However, those living in multi-occupancy dwellings in large cities may not have access to home charging.
The positive news is that when they do use public charging, users are generally satisfied with the experience (see Figure 20).
Globally, public charging has a +35 net satisfaction score among EV owners, similar to what research revealed in 2021 when there were fewer EVs on the roads. The lowest (but still net-positive) satisfaction is in Northeast Asia, where it scores +7, with charging speed and waiting time the biggest issues. In Europe, price (with our survey undertaken at a time of high electricity prices) and waiting time are the biggest issues. EV drivers in the US are the most satisfied with public charging (+49), likely linked to the charging network provided by Tesla, which sells over half of the EVs in the US market.
When choosing a public fast charger, the most important criteria are convenience (proximity, short waiting times) and charging speed. Globally, 56% of respondents cite proximity, 53% charging speed, and 50% certainty of no waiting time as the most important factors when choosing a charging location. While these factors are consistent across regions, preferred payment methods vary:
- Credit cards are the number one choice in Northeast Asia (59%), Europe (55%), and the US (52%).
- App payment is preferred in China (54%) and Southeast Asia (42%).
- The global average split for payment methods is 37% bank credit card, 33% app, 21% charge card/mobility service provider, and 9% plug and charge, where charge points automatically exchange data with the car via the charging cable to authorize charging.
5
DIGITAL’S IMPACT ON SALES MODELS
The automotive industry’s traditional distribution model is via third-party retailers (“dealers”). This approach is expensive; distribution costs (excluding customer discounts) make up 15%-20% of a new vehicle’s price for a B2C sale, while also preventing OEMs from having a direct relationship with their retail customers. Digitalization in the channel has been addressing these two challenges (cost and relationship) over the past 15 years. In particular, the search and configuration stages have progressively moved online during this period, while many OEMs are selling a small share of their vehicles directly to retail customers through their websites. So how are attitudes changing when it comes to buying cars online via digital channels?
BUYING ONLINE
Customers overwhelmingly value personal consultation during the automotive purchase process, with over three-quarters (77%) naming it as the number one factor driving satisfaction (see Figure 21). The personal touch is particularly important if a car is being bought outright, rather than leased or rented, given the large sums of money involved. This factor is followed by transparency and customer-centricity/feeling appreciated (both scoring 49%), with a convenient purchase process ranked as the sixth most important reason (40%).
This strong customer preference for personal attention limits the use of digital tools to the top of the sales funnel (search, information, configuration, pricing), as shown in Figure 22. The middle and bottom of the funnel, covering activities such as test driving and deal closing, remain mostly in-person — just 25% of global respondents said they were happy to close the deal online. There are regional variations, with participants in the Middle East (53%) and India (37%) the most open to digital transactions.
Age is again important, with digital natives, aged between 30 to 44, the most open to buying their next car online; respondents under 30 are also broadly positive. With the exception of digital-friendly China, older groups still strongly prefer traditional, physical sales models.
Across all regions, the higher the income, the greater the willingness of respondents to buy their next car totally online, including making the final payment (see Figure 23). This income effect split is strongest in Southeast Asia (30-point difference in favorability between very high incomes and low incomes) and the Middle East (32-point difference). By contrast, few among even the highest earners in Europe and Northeast Asia view buying totally online favorably, while the lowest income groups see it negatively.
WHAT DO BUYERS WANT FROM ONLINE PURCHASING PROCESS?
To drive online sales, OEMs and their dealers need to understand both positive and negative customer views around online purchasing. When asked what they saw as the benefits of buying online, respondents overwhelmingly picked “no pricing games” (86%) ahead of speed/convenience (68%). Essentially, buyers want to feel that they have secured a fair deal, and they believe that the transparency of online channels helps deliver this. Perceived benefits vary between income levels; 61% of lower earners prioritize lower prices when buying online, while 70% of high-income groups see the “faster/more convenient process” as the major advantage.
The biggest barrier to buying online is that customers want to literally kick the physical tires of the vehicle they are purchasing (cited by nine out of 10 respondents) and gain personal advice (56%) — see Figure 24.
Backing up this desire to physically experience the car, the preferred test-drive location for more than half (55%) of respondents globally is at the dealership. Depending on the region, the number of visits to the dealership varies. While the global average is 3.3 (see Figure 25), in higher-income countries this falls to two to three trips and rises to three to four visits in average-income countries. This points to a need to offer buyers additional reassurance in these markets to streamline the process and get the sale over the line.
CONCLUSION: STEERING AWAY FROM “CASE”
The “Future of Automotive Mobility 2024” Report moves us beyond CASE as a framework to understand industry development. While connected is a given and the electric transition is irrevocably (if unevenly) underway, autonomy is not trusted by customers and sharing cars with others is neither economically viable nor popular outside ride hailing (taxi) services.
As Figure 26 shows, regional differences cover all aspects of mobility, from the importance of car ownership to sales models, and must be understood and acted upon to deliver what specific markets require.
Cutting across this, different income groups have specific preferences and requirements that need to be met, and OEMs must cater to the varying attitudes of BEV owners/intenders and ICE loyalists.
Our experience, combined with the research, uncovered multiple opportunities:
- Mobility by car, independent from public transport networks, timetables, or the availability of shared mobility options, is still the preferred travel option for most respondents. Customers in emerging economies still aspire to increased private motorization. The center of gravity in the global automotive industry will further shift to those regions.
- Rather than being a short-term bridge to EVs, hybrids (PHEV and HEV) will remain a powertrain alternative for the near future. Manufacturers should look to cater to the needs of those looking to electrify their mobility while overcoming range anxiety.
- Electrification will continue, but progress will not be linear across the globe. Manufacturers need to select their target markets and customers wisely to prevent wasted efforts and lost sales. The key challenge in most markets outside of China is still to convince the mainstream customer to transition away from ICE vehicles.
- Automated driving, where technology assists the driver, is popular in many markets, but safety fears are holding back adoption of technologies beyond L3 in regions such as Europe and the US. OEMs should tailor their offerings accordingly and focus on automation that drives value for customers.
- Customers are increasingly open to sales digitalization, but this needs to work effectively with physical points of sale at key points of the customer journey (e.g., test drives). Whether these points of sale are operated by the OEM or independent retailers does not make a difference to the buyer; providing quality human interaction is what’s important.
Notes
[1] ADL has highlighted the underlying causes, together with the potential role of car sharing within the broader ecosystem, in the recent Report “Sharing in Success.”
[2] For all figures in this Report, values are weighted by country car sales.
[3] Van Audenhove, François-Joseph, et al. ”Future of Mobility 3.0: Reinventing Mobility in the Era of Disruption and Creativity.” Arthur D. Little, March 2018.
[4] “Global EV Outlook 2024.” International Energy Agency (IEA), April 2024.
[5] Premium brands include: Volvo, Audi, BMW, Jaguar, Tesla, Lexus, Cadillac, Mercedes, and Nio; volume brands include: Citroën, Fiat, Ford, Hyundai, Jeep, Kia, Nissan, Opel, Peugeot, Renault, SEAT, Skoda, Toyota, Volkswagen, and BYD.
DOWNLOAD THE FULL REPORT
RELATED INFORMATION

Paris 2024 Olympics
After the Paris 2024 Olympic and Paralympic Games ended in early September, the media, event organizers, and the International Olympic Committee (IOC) evaluated their success in terms of attendance,…

State of the media market, 2024

The mobility leaders survey, 2024
In preparing the fifth edition of the “Future of Mobility” Report, Arthur D. Little (ADL), in a joint effort with BVA Xsight and POLIS, conducted a quantitative global survey to explore the…