The pandemic sent many mobility operators reeling, yet one subsector found its time to shine: bike sharing. Fueled by ever-growing demand for cost-effective mobility, the sector grew its global revenue by a third in 2020, while all other mobility services suffered setbacks, according to Statista. More than ever, bike-sharing service providers and cities must facilitate their relationships and service-level agreements (SLAs) to build the perfect public-private partnership. In this Viewpoint, we explore key components for operational excellence in bike-sharing services, how these components impact customers, and three ways bike-sharing operators can improve performance/SLAs and reduce costs.
THE RISE IN BIKE-SHARING USAGE
Bike-sharing schemes are increasingly attractive to cities and municipalities as they recognize the importance of providing active modes of mobility for people and communities to build healthier habits, which ultimately can create positive economic, social, and environmental impacts. In fact, in 2020, as reported by TechCrunch, North Americans enhanced their lifestyle with an additional 12.2 million hours of physical activity and, via the use of bike shares, offset about 29 million pounds of CO2 to improve their carbon footprint.
Due to their nature, bike-sharing schemes (and, even more specifically, docked or hybrid schemes) are frequently designed and developed as public-private partnerships. In fact, approximately 42% of all bike-sharing schemes are based on city-issued requests for proposals (RFPs), which means the operator must prioritize and comply with the objectives of the local governing body. It also means that performance is measured against SLAs. The policy framework and SLA thus have a direct impact on the sustainability of any bike-sharing operations and, ultimately, on the uptake of bike sharing by users.
Achieving SLAs in bike-sharing schemes
Customer adoption and satisfaction are among the overarching objectives of bike-sharing SLAs. Customer satisfaction, in particular, is typically measured across three KPIs: (1) availability of bikes and/or docks when needed, (2) quality of ride, and (3) number of trips. However, there are a limited number of ways an operator can positively contribute to improving those KPIs, while keeping costs under control. Some affected factors include:
- Distance between stations. While not purely an operational KPI and often not an SLA (usually the municipalities or the city authorities decide the network design), the number of stations and average distance between stations have significant implications for the network’s natural balance, average distance per trip, and operational costs.
- Number of bikes in the system. A first driver of availability in free-floating schemes, the number of bikes is measured in terms of a docks-to-bike ratio in docked systems, which typically varies between 1.5 and three docks per bike. The ratio has a direct impact on the availability of both bikes and free docks, which are the first two drivers of customer service level.
- Bike lifespan. Shared bikes are used significantly more than privately owned bikes. This is even more true for shared e-bikes, which typically show an average of six to 12 trips per day versus one to five for mechanical bikes, according to movmi. Reduced care from users and changing weather conditions can cause further deterioration of the bikes. Therefore, shared bikes should have a solid design to reduce long-term maintenance costs.
- Maintenance. Ensuring the right level of functional bikes within the system is a KPI in most bike-sharing schemes’ SLAs. Maintenance can be performed onsite or in workshops, and operators choose one or the other depending on what the budget will allow. For free-floating e-bike schemes, this activity also includes onsite battery swaps.
- Rebalancing. While all bike-sharing schemes are naturally imbalanced, the rebalancing objective is usually to empty full stations and fill empty stations in docked schemes or to bring back bikes into usage areas for free-floating systems.
Arthur D. Little (ADL) and movmi have worked extensively within the bike-sharing ecosystem, supporting operators as well as municipalities and city authorities to define mobility strategy and improve both operational excellence and the quality of service (QoS) of bike-sharing schemes.
Through ADL’s Future of Mobility (FoM) lab, we recently partnered with movmi to perform a comprehensive benchmarking study of bike-sharing operations, which included in-depth discussions with CxOs of 16 operators of docked, free-floating, and hybrid schemes worldwide as well as with bike-sharing commercial and operations subject matter experts across the globe to identify key levers of operational efficiency and customer excellence in bike sharing, which we explore further below.
Excellence lever #1: Bike lifespan
It is important to note that in a bike-sharing operation, KPIs and the methods in which they are reached are all connected; system performance thus relies on the performance of the overall chain. For example, any improvement in bike lifespan translates into fewer broken bikes on the streets, which means fewer bikes are needed to keep a reliable bikeshare system running. It also means less stress on maintenance operations and costs. Moreover, bike lifespan is the foundation of cost-efficient operations; everything else builds upon it.
It may appear simple on the surface, but the design of bikes, particularly shared bikes, can be complex. As we mentioned, bike-sharing bicycles are exposed to higher stresses than personally owned bikes. Improving the lifespan of bikes therefore means improving the lifespan of each individual part or subsystem. Critically, every bike may be repaired several times over its lifespan; the only part that cannot be changed is the frame. The main objective is thus to allow for longer intervals between repairs.
However, while the wheels and transmission (pedals, chain, and gears) remain the greatest causes of breakdown, improving the robustness of these systems is a challenge. Taking docked schemes as an example: overall best-in-class systems highlight a maintenance interval (or maintenance time between failure) of 5,000 km (~3,100 miles) for mechanical bikes and 3,000-4,000 km (~1,850-2,500 miles) for e-bikes.
Shared bikes can be inherited from a previous operator, purchased from a supplier, or assembled from available component parts on the market. The operator has full control of this area and is thus a place where operators can influence overall operating costs.
Excellence lever #2: Smart maintenance structures
Maintenance comprises the lion’s share of operational costs in bike-sharing schemes, usually averaging two-thirds of total operating expenses. Our recent benchmark study highlights some strategies for reducing maintenance costs, including the location of bike repairs (see Figure 1):
- Repairs at station only. The preferred solution for small (typically less than 500 bikes) mechanical bike-sharing systems is to make repairs at the station. Each staff member is a fully qualified expert who can handle different types of repairs with a few specialized tools directly at the station. For more serious repairs, the bikes are taken to a workshop.
- Workshop repairs. For medium-scale operations (typically 500-2,000 bikes) with lower utilization (one to two trips per bike per day), or seasonal bike use, the preferred solution to maintenance focuses on preventive maintenance at the workshop. With lower bike utilization, it is easier to schedule maintenance sessions at the workshop every two to three months for each bike. However, this method is rather costly and also bears the risk of increasing the overall repair cycle time. Keeping broken bikes parked in stations, either because they haven’t been identified as damaged or didn’t fit the repair schedule, can also damage the operator’s brand image.
- Mixed repairs. The most common solution for medium and large bike-sharing schemes (e.g., Paris, Mexico, Vancouver) combine heavy maintenance in workshops and light repairs or tunings at stations (e.g., brake settings and wheel replacements). These depend on the bikes’ modularity, fleet, and tools, as well as the ease of making repairs onsite.

Overall, best-in-class schemes reveal a general repair cycle time of less than four days — from the bike being reported to the bike coming back into the system — although this may require increased staffing and higher costs. To maximize the system’s performance and minimize costs, operators should consider the following three questions:
- How can we balance onsite maintenance with workshop maintenance?
- What is the optimal time from the report of a broken bike to collection in order to maximize service and minimize costs, and can we balance collection lead time to minimize the number of collection stops?
- How can we increase the repair staff’s specialization level to maximize repair operations efficiency?
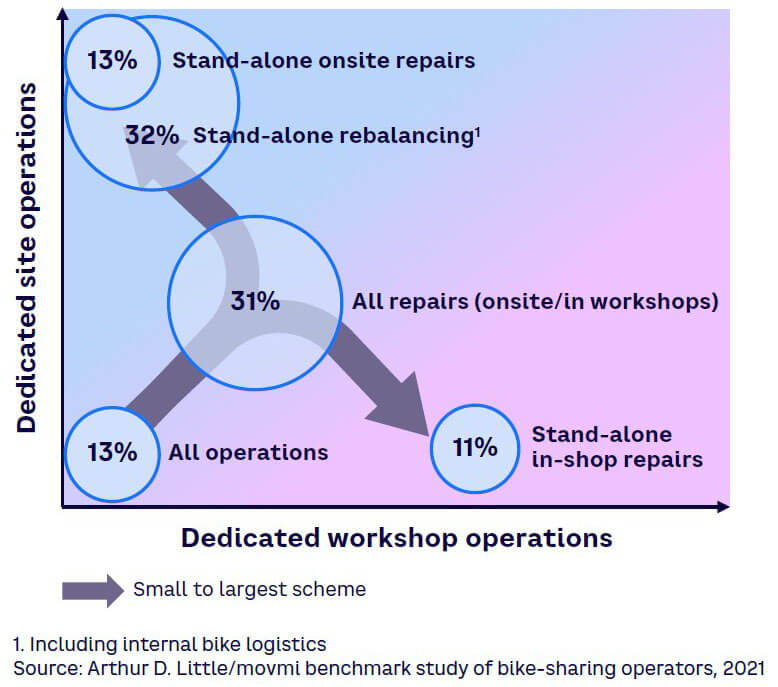
Key points we noted in our research relate to operational organization among the bike-sharing operators we surveyed (see Figure 2) and include:
- Small operators tend to operate under a joint team for site operations (repair and regulation) and workshop repairs.
- Midsized operations start by organizing all repairs within one team.
- A rebalancing team is dedicated to ensuring control over operators’ performance.
- The largest-scale operations have specific teams for onsite repairs, regulations, and workshops.

Excellence lever #3: Rebalancing
Often considered one of the most important service excellence levers in bike-sharing operations — as it directly replies to KPI #1 of SLAs: availability of bikes and docks — rebalancing means moving bikes around so that there are bikes available where they are needed, or at each station in the case of docked and hybrid schemes. Either the stations are naturally balanced (i.e., the same number of departures and arrivals) and thus can sustain the number of bikes over time, or they are not, in which case the stations return to their previous equilibrium after some elapsed time, depending on the potential traffic at the stations. For example, if you drop bikes at the top of a hill and leave docks empty at the bottom, it allows users to ride downhill and park their bike. However, if you wait too long to rebalance, all the original uphill bikes will be at the bottom where all the stations are full. Operationally, this can be difficult to manage.
In addition, rebalancing efforts appear to have only marginal impacts on the KPIs they are meant to improve. A concrete example can be seen in the large, docked bike-sharing scheme of Vélib in Paris, which has an average of 140,000 trips per day. Improving bike availability in stations by just 1% would be equivalent to moving at least 1,400 bikes per day. While 1% is the actual rebalancing contribution to traffic (additional trips), improving the measured service level (i.e., availability of at least one bike in stations) can lead to unwanted and surprising outcomes. Indeed, it appears more efficient from a KPI standpoint to drop bikes in empty stations, but only where they won’t all be taken. In such cases, the strategy of rebalancing improves the KPI but does not maximize the contribution for actual uptake in usage and customer satisfaction. Thus, we should question the relevance of the KPI and the extent to which it leads to an improvement of quality of service (or service level) or whether rebalancing could instead lead to unwanted effects. In this specific case, collecting and dropping bikes where they are needed most — and not particularly with the aim to increase the “availability in station” KPI — would have a superior impact on service level than would rebalancing.
Excellence lever #4: Adding bikes
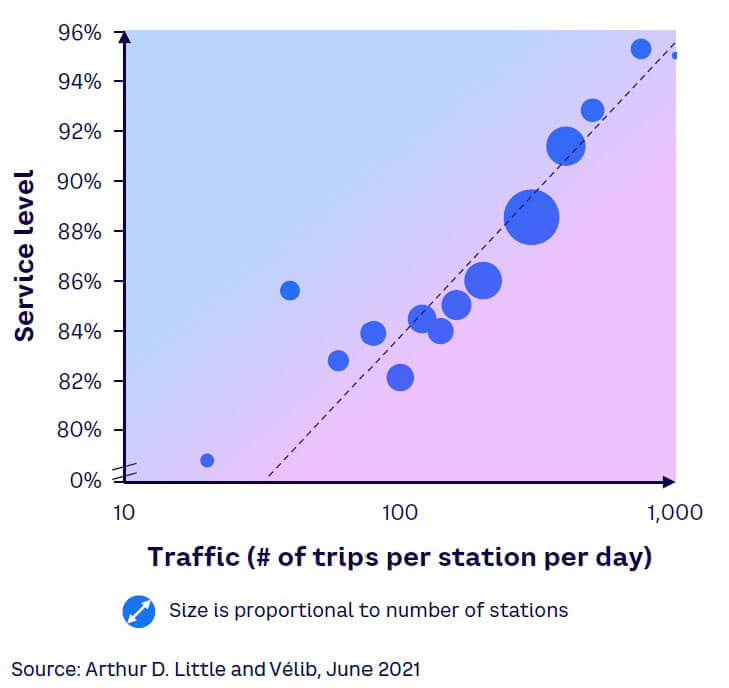
The service level of a bike-sharing scheme should not necessarily be measured by the availability of bikes in a station but by the overall ability of the system to satisfy demand. Figure 3 (an illustration of performance in the Vélib bike-sharing network in June 2021) shows a strong correlation between the level of traffic (i.e., the number of bikes in circulation at a given time) and the service level (i.e., the ability of the bike-sharing scheme to meet demand). Hence, the service level at a station directly correlates to its traffic (i.e., daily arrivals and departures): the higher the number of (arriving or departing) trips, the higher the service level. Clearly, the service level strongly correlates to general bikeshare traffic. In other words, empty stations with high traffic are never empty.

Natural balancing through adding or removing bikes where relevant rather than rebalancing thus sometimes makes more sense than rebalancing. That being said, natural balancing requires proper planning to maintain the proper bikes-to-docks ratio (i.e., adding more bikes to the overall fleet and injecting them into the system when demand is high on one side, or keeping them in a warehouse if the system is saturated on the other side). While adding bikes will increase capital investment, it will also significantly reduce operational costs while improving overall service availability.
Adding bikes will depend on the current bike-to-docks ratio and is not the panacea for all bike-sharing networks. In fact, in many situations it cannot be used to fully overcome the natural imbalance of a network. But in some cases, it can make a real difference. That was true in our analysis of the Vélib scheme, which demonstrated that there was still room to add bikes to the system. Thus, the result can be a better service level while being 10 times less costly than reaching the same service level with rebalancing alone.
Conclusion
Aiming for premium bike-sharing service level
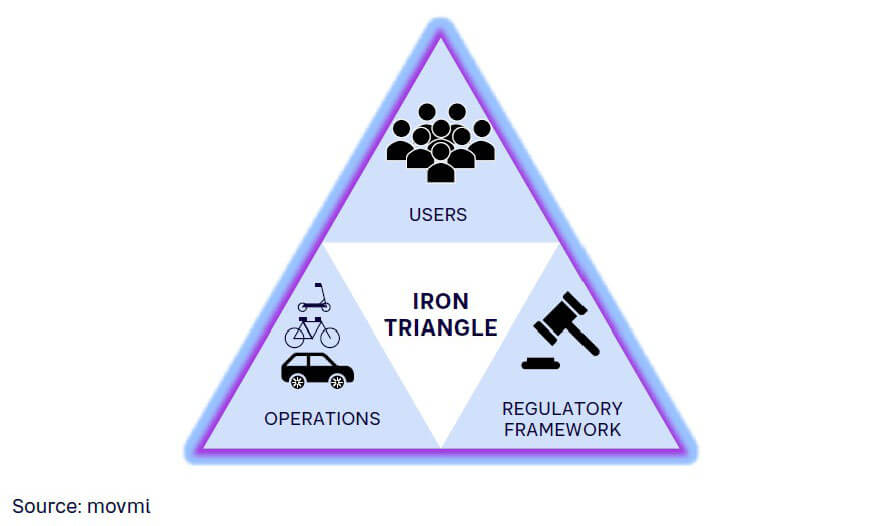
Service-level KPIs, as they are commonly detailed and measured in bike-sharing operators’ SLAs with cities, do not always constitute a fair measure of bike-sharing operators’ operational and commercial excellence. As we have discussed, some service-level discrepancies are due to the design of the network (imbalance) and of local demand (traffic). It is therefore essential for governing bodies aiming to develop a bike-sharing scheme to understand and map natural flows while assessing demand to allow for the best definition for the network itself and of operational targets. Indeed, like other urban mobility solutions, bike-sharing schemes abide by the balancing of the “iron triangle” of shared mobility (see Figure 4), which illustrates the importance of balancing governing bodies’ regulations, operational performance targets, and user expectations.

To summarize, operators have three main levers to increase operational efficiency:
- Every time they can increase the lifespan of a bicycle part, they will save money and enhance the service level.
- Onsite and workshop repairs by the maintenance team must be optimized for the size of the bike share.
- Rebalancing efforts are not always the only solution and can, in some cases, be replaced or complemented by more natural (rather than station) rebalancing through adding and removing bikes in the overall system.
And, finally, operators have an additional tool to potentially improve the service level:
- Adding bikes to the scheme can, to a certain extent, increase traffic and hence overall service.


