50 min read • Automotive
Global electric mobility readiness index — GEMRIX 2022
Examining the transformation to EV mobility
FOREWORD
Accelerated by the increasing threat of climate change, interest in electric mobility has escalated over the last four years, both within companies and across societies. At the same time, legislative and societal pressure on companies to counter climate change through new products, processes, and purpose has grown as well. The combination of these drivers have moved e-mobility topics up the strategic agenda for automotive executives around the globe.
Despite the mature globalization of the automotive industry, markets and their requirements differ significantly around the world. These differences must be well understood to successfully implement a “once in a century” disruption like the change from fossil liquid energy to electric energy — the change from molecules to electrons.
To assist executives in automotive organizations of all kinds around the world, Arthur D. Little (ADL) has set up a methodology to evaluate the “readiness” of markets for electric mobility. The standardized approach and detailed analysis of key market drivers for electric vehicles (EVs) enables a solid understanding of the current situation, and a standardized approach and evaluation metrics allow for comparisons across markets of overall readiness.
In this Report, we provide an overview of the key results of the 2022 edition of the “BEV Readiness Study,” which ADL first carried out in 2018.
— Dr. Andreas Schlosser, Partner, Global Lead, Automotive
EXECUTIVE SUMMARY & KEY FINDINGS
E-MOBILITY MARKET READINESS SPREADS WITH EVs GAINING GROUND
There has been a massive jump in EV adoption worldwide during the last two years. Norway has emerged as the leader, followed by three distinct groups of countries. All countries are moving to increase EV adoption, following similar patterns but with differences in time by a few years, as some started earlier than others. We discern differences between global markets primarily in specific legislation and to a lesser extent in socioeconomic factors. (In countries with higher income, for example, environment protection plays a crucial role, while in countries with lower average income, cost is the primary determining factor.)
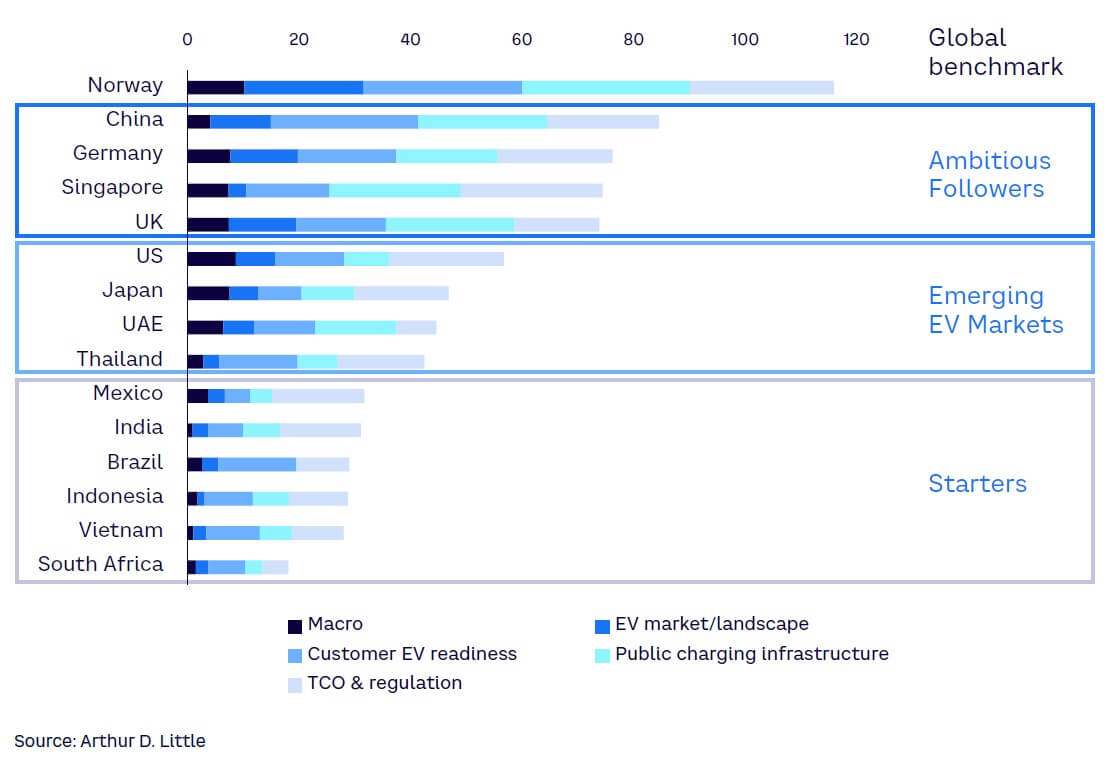
Norway leads in EV adoption with a score of 115 in the 2022 ADL Global Electric Mobility Readiness Index (GEMRIX 2022). Next come the Ambitious Followers — China, Germany, UK, and Singapore — where all prerequisites for EV mobility are in place and EVs are on the verge of becoming mainstream. These countries are followed by the Emerging EV Markets: US, Japan, UAE, and Thailand. Here, EVs are still inferior to cars with an internal combustion engine (ICE), even though customers are becoming more comfortable with the idea of EVs as infrastructure is ramping up. Lastly, the Starters — Mexico, India, Brazil, Indonesia, Vietnam, and South Africa — have just entered the game and face major challenges in costs and infrastructure.
Among those benchmarked, Norway is the only country with an EV sales share of more than 50%. Among Ambitious Followers, EVs have a comparatively low share of approximately 15%-25%. Leading markets have a range of models, with six countries having more than 75, led by Norway and Germany. However, for globally acting OEMs, there is no one-size-fits-all solution. Manufacturers need to ensure supply while crafting individual sales strategies for countries, based on the readiness of each market.
Regarding Customer Readiness, cost is one of the most, if not the most, important drivers of EV adoption. This poses a challenge in developing countries as EV prices are still high and income is comparatively low. Thus, OEMs need to decrease costs while governments need to create incentives to pave the road to success and allow customers to enjoy electric mobility.
In terms of Infrastructure Readiness, battling range anxiety — the fear that a vehicle’s battery will not have sufficient charge to reach the destination — is a key issue. DC chargers are the right bet, as they lower charge time, are perfectly suited to highways, and decrease range anxiety. Charging industry players should focus on the Emerging EV Markets — as these countries are about to solve the chicken-egg problem (i.e., determining which must be in place first, infrastructure or EVs), if they haven’t already done so, and governments are pushing infrastructure buildup and players can win large-scale contracts.
Government Readiness hinges on a government’s willingness to take the first step by introducing wide incentives for purchasing vehicles. Customers should not pay a premium for EVs. Moreover, governments need to reduce the total cost of ownership (TCO) by introducing incentives for vehicle usage. Promoting EV adoption in Emerging EV Markets and Starter Markets will give charging infrastructure players the incentive to enter a country, creating a reinforcing spiral of EV adoption.
Betting on EV is no longer a risky gamble, and the predictability of the EV market is continuing to grow. The only major driver that cannot be fully predicted is government policy. However, making reasonable assumptions about this will give the industry in all countries firm ground on which to base their planning.
1
GLOBAL E-MOBILITY READINESS DISTRIBUTION
Markets worldwide are at three levels of readiness; only Norway has achieved “full readiness”
We are in the midst of a paradox of electric mobility: Norway, a country that became rich by drilling for and exporting fossil fuels, is the only market worldwide that is already fully EV ready. With a score of 115 on the GEMRIX 2022, EV is the clear choice in Norway. The index is designed to compare the market conditions for EV and ICE-driven vehicles. An EV readiness score of 100 means that in a given country it is equally beneficial to buy and operate an EV as one with an ICE. Higher values indicate advantages for EVs, while lower scores mean benefits for ICEs.
The rest of the benchmarked countries following Norway can be broadly categorized into three clusters as to their readiness (see Figure 1):
- China, Germany, UK, and Singapore are Ambitious Followers, with around 80 points. In these countries, switching to EV is no longer just an option for some enthusiastic pioneers; rather, it’s becoming a valid choice for the mass market. In the near future, all four countries have a concise political agenda to reach equality between EV and ICE. Driven by this agenda, the industry is gearing up in the respective countries. Consequently, consumers have seen a major jump in recent years in the number of available EVs and charge points.
- The Emerging EV Markets we see in the US, Japan, UAE, and Thailand have scores between 40 and 60. These markets still show significant drawbacks financially as well as in ease of operation for EV over ICE. However, all of them are investing heavily in electric mobility and will likely catch up soon. The US plays a special role in this group. As the home of EV pioneers like Tesla venture out to electrify the world, the US scored roughly 10 points over other countries in this group. The US is in a unique position, as the prerequisites for EV in East and West Coast states are very good, while in large parts of the country and much of the population, especially in the central states, ICE cars remain the emotionally and economically preferred option.
- Finally, we see a group of Starter countries, comprised of Mexico, India, Brazil, Indonesia, Vietnam, and South Africa. In these countries, electric mobility is beginning to enter the conversation; however, given their socioeconomic position, EVs are not a priority among politicians seeking election. In these countries, choice of vehicle is driven more by cost and utility considerations than by green aspects. Accordingly, we see an uptake in areas where TCO of EV starts to be equal or even better than ICE. Currently, this appears in the two- and three-wheeler space, which in those Starter Markets accounts for a significant share of the overall market. For example, in FY 2022, 46% of three-wheelers sold were already electric in India.[1]
Unsurprisingly, we see significant progress in EV readiness in all the benchmarked countries. However, reasons for this uptake (and for holdbacks) are very different per country. In the following chapters, we take a closer look into specific areas that are important for EV readiness and compare the different positions of the benchmarked countries. We follow up with deeper insights into each market to better understand the specific situations for manufacturers, customers, and other players along the value chain.
2
E-MOBILITY READINESS FACTORS
The overall EV readiness of a market is defined by four separate readiness factors
Studying global EV markets, we find that market readiness and EV adoption are driven by different factors in different regions. In some markets, environmental friendliness is key, while in others, ease of use (or the lack thereof) is the main factor in adoption. Many countries, especially those in the Starter group, primarily focus on cost, which has different aspects.
To summarize, the following four main factors of readiness drive EV adoption: (1) market, (2) customer, (3) infrastructure, and (4) government. We used these readiness factors as a framework for our analysis.
1. MARKET READINESS
Industry players in each country contribute significantly to the attractiveness of EVs to customers. The number of vehicles offered and how they are brought to market can spark the interest of consumers or can prevent them from even thinking about EV if the offer is not attractive. This involves a combination of factors, including the number of products offered and the segments covered by them, product quality, design and concept creativity, as well as pricing.
2. CUSTOMER READINESS
How ready a customer is to buy an electric vehicle does not hinge only on objective factors like the availability of home charging points. It is also a very subjective matter, influenced by the general perception of EVs and personal preferences. For this study, we looked at the hard facts and the predominant socioeconomic conditions in each country to assess customer readiness.
3. INFRASTRUCTURE READINESS
Infrastructure readiness primarily comes down to the availability and performance of charging options (i.e., the number, distribution, and quality of public charge points). Even in the benchmark market, Norway, most EV charging still occurs through private options today. However, a dense public infrastructure lowers psychological barriers for customers and increases EV usability. It is also a precondition to reach customer segments without private parking and charging opportunities (whose demand for EV will reduce the share of home charging in the future). To evaluate infrastructure readiness, we also investigated charging power (AC, DC, and high-power charging) in addition to the pure number of facilities available. Finally, we took geographical distribution into account. In the end, even the best inner-city charging network does not help when traveling long distances.
4. GOVERNMENT READINESS
Legislative and regulatory bodies play a central role in shaping the market for EVs. The entire ecosystem around ICE vehicles has evolved and was optimized for more than a century, supported by unimaginable investments and subsidies. Without specific incentives and legislative interventions, it is next to impossible to overcome this head start in the time required for climate protection. Different governments found different approaches to incentivize EVs and/or disincentivize ICE vehicles, which we analyzed in terms of their implementation and effectiveness.
Together, these four factors provide an overview of EV readiness in each country, not only in arriving at their overall readiness score but also in gaining insights into the measures needed to increase EV readiness. We discuss the latter later in this Report in the chapter “The Next Steps.”
3
MARKET READINESS
Competition in EV skyrocketed last two years, providing customers with progressively better options
The dynamics of EV markets globally have proved to be very volatile. While just two years ago the EV market outside China was dominated by emerging players (with Tesla leading the way), many incumbent OEMs have since raced to overtake them (see Figure 2).
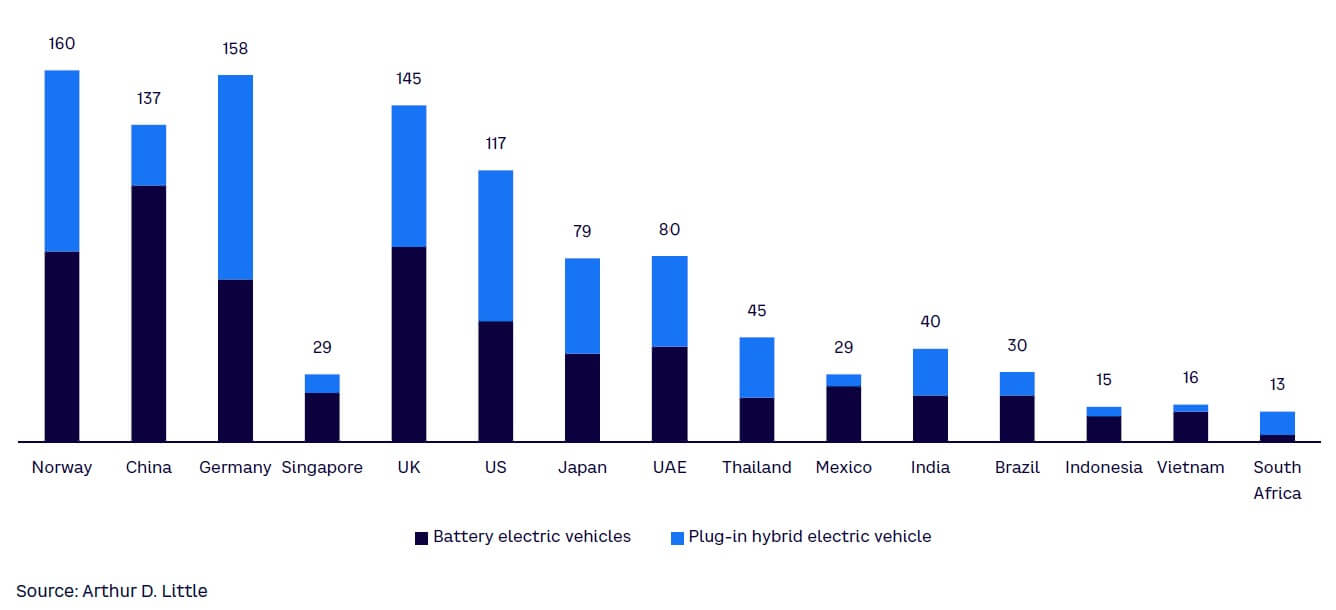
German OEMs are a good example of this volatility. Up to 2019, they only reluctantly introduced EVs. Customers interested in electric cars of a new kind largely had to turn to Tesla. Starting in 2020, however, pushed by government initiatives and the pressure of coming late to this important future market, German OEMs rapidly introduced new all-electric lines and models. Mercedes-Benz introduced its EQ line and Volkswagen the ID, Audi expanded its e-tron brand, while BMW i experienced a rebirth with more models next to the i3. With all domestic OEMs offering EVs, Germany jumped to the second position behind Norway in the number of available EV models, with 158. Markets such as the UK and the US saw a very similar uptake, as major US OEMs — including Ford and GM — also electrified their mainstream model lines.
Plug-in hybrid electric vehicles (PHEVs) have played an important role in EV adoption in early market phases (e.g., Norway, the Netherlands, and Germany). However, commonly, it is a shift in customer demand and vehicle supply toward purely battery electric vehicles (BEVs) that mark a maturing EV market. Effectively, a falling number of PHEV models with an overall growing preference for EVs is a strong sign of a more mature EV market. We foresee this as a development for Starter countries as well. Brazil, Indonesia, Vietnam, and South Africa, for example, have a very high share of PHEVs today, which will decline over time.
However, we see a much different story in the developing markets: Thailand, Mexico, India, Brazil, Indonesia, Vietnam, and South Africa. India illustrates the dynamics in these markets: with 40 different types of vehicles on offer, customers enjoy a good variety. Nevertheless, this is mainly in the two- and three-wheeler space. While private cars in India do not yet have a significant share of the EV market, scooters and commercial three-wheelers for logistics and transport services have a massive uptake. Significant competition has developed, driving prices down and quality up. Production of electric scooters and three-wheelers has reached large-scale efforts; electric two- and three-wheeler sales grew at 460%[2] and 102%,[3] respectively, in FY 2022. The cost advantage of waiving ICEs led to very competitive sales prices. Combined with the recent increase in oil prices, the total cost of operating electric two- and three-wheelers is much lower than that of other vehicles, which is the most important factor in these countries.
4
CUSTOMER READINESS
Price vs. purchasing power and access to charging infrastructure are global drivers of customer readiness
Broadly speaking, the readiness of customers to buy an EV is determined by their willingness and ability to do so. Ability comes down to accessibility and price. Even though the prices of EVs have fallen, investing in a vehicle in many countries remains a major undertaking — even more so in the case of an EV (see Figure 3). In Thailand, for example, the average yearly income is US $5,716. This market offers a variety of ICE cars in the price range of US $9,000-$12,000, a cost barely affordable for many. The cheapest EV car in Thailand starts at just below US $30,000. At that price, electric four-wheelers are not accessible by the general public. In two-wheelers, however, prices are much more attractive. An ICE scooter starts at approximately US $900 and an electric scooter is available at almost the same price. Additionally, the scooter can be charged using a standard household plug, while a car would require the installation of a wall box or a public charging pole, an additional hurdle for the average customer in Thailand.
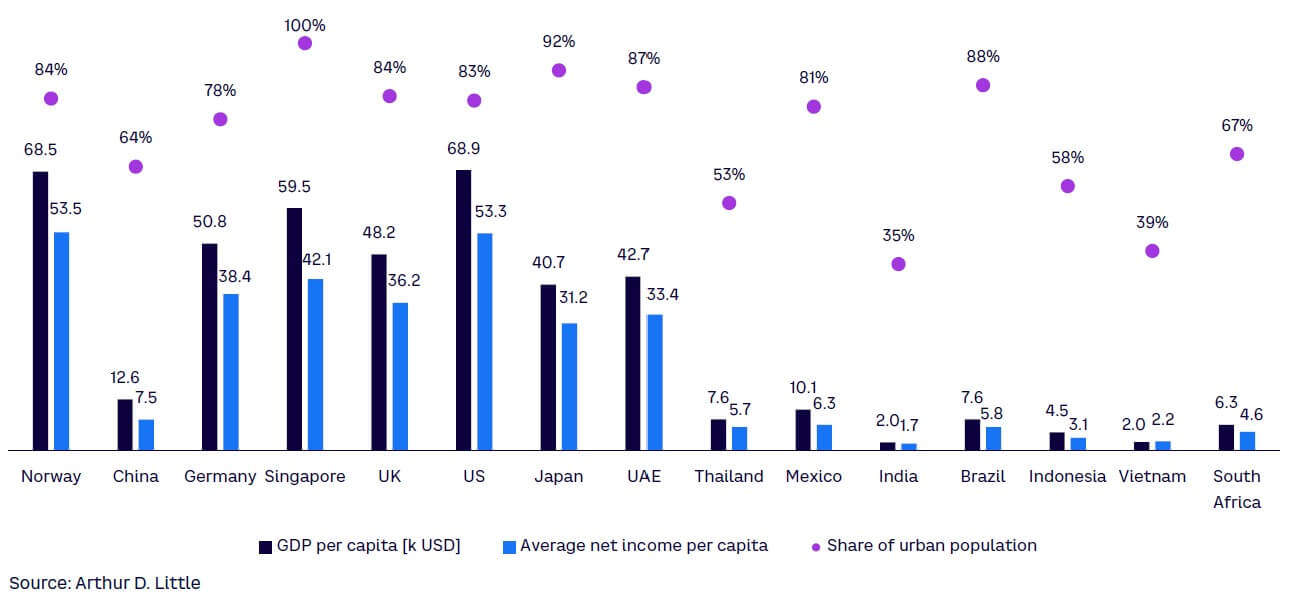
The topic of charging naturally leads to accessibility. In ADL’s study, we see a correlation between the share of population living in urban areas and EV readiness. Lack of access to public charging infrastructure is a massive hurdle to the adoption of EV. Globally, the density of public charging points in rural areas is nowhere near the density of petrol stations. With most EVs still of lower range as compared to their ICE counterparts, countries with a large rural population have a significant challenge to solve, as is very visible in India and Vietnam. Again, this hurdle is much less pronounced for two-wheelers, which can effectively be charged using standard household power lines.
Concerns about environmental protection play the second most important role in readiness to buy an EV. We see a clear correlation between EV readiness and environmental awareness, as measured primarily by the number of governmental activities and the number of years since those activities were introduced. While this aspect is very important in Norway and Germany, in a country like India it only reaches a very small group of customers. Furthermore the “coolness” of driving an electric car is a determining factor — again, primarily in Europe and North America.
In summary, GDP and income levels indicate if a market is driven primarily by cost or if societal trends like environmental protection play a role.
5
INFRASTRUCTURE READINESS
Government support is necessary to kickstart development of public charging infrastructure
Before market solutions and entrepreneurial players for charging infrastructure can arise, governments need to invest to support development (see Figure 4). The experience from leading markets like Norway and China shows how governmental programs powered — and are still powering — the expansion of charging infrastructure. Before companies became active and EVs rolled over streets in high numbers, the Norwegian government implemented a €7 million program for kick-starting its charging infrastructure rollout, resulting in nearly 2,000 charge points by 2011. Additionally, Norway supported funding for housing associations to install private charge points early. China follows a similar approach — the more than 1 million chargers it boasts today were mainly built and operated by the government or through state organizations and companies.
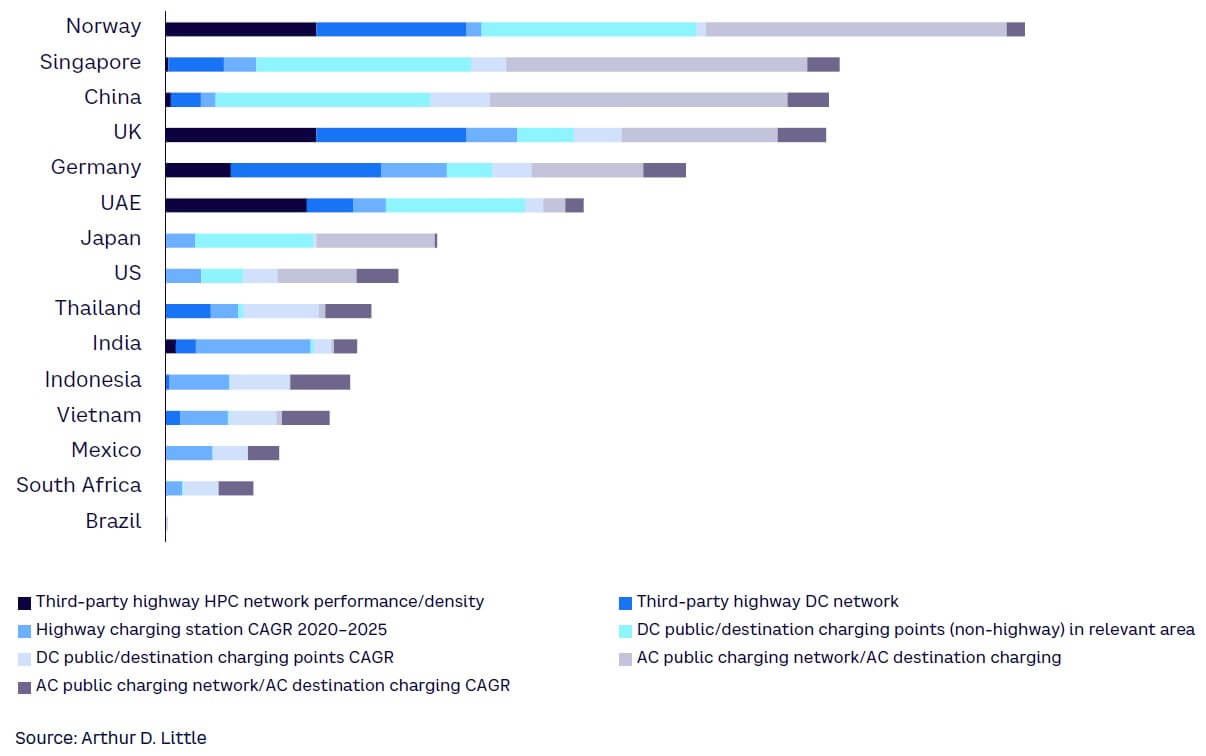
Charging infrastructure is critical for customer adoption of EVs. In the US, 30% of respondents to a Forbes poll said there are too few charging stations available, hinting at the problem of range anxiety.[4] In the US, only around 6,000 fast charging stations are installed so far (1,400 of them exclusive to Tesla) compared to the roughly 260,000 km of highway network. This could be why battery electric vehicle (BEV) sales share in the US was at less than 4% in 2021.[5] However, the current US administration has implemented a US $5 billion program to install 500,000 more charge points over the next five years.
FAST CHARGING REQUIRED
While in embryonic EV markets the availability of private charging at home or at workplaces is the key enabler, every significant step-up in a market’s EV adoption requires public charging infrastructure. Only a dense-enough and easy-to-use public charging infrastructure enables long-distance travel by EV and opens the market to those customers without access to private overnight parking with electric power supply.
Because the lack of public charging is the greatest hurdle in starting EV markets, and the costs of infrastructure setup and charging play a major role, AC charging up to 22 kW was the first choice in early EV markets. While these charging speeds are sufficient for small battery packs and charging use cases that allow for several hours of charging, they fail in en route charging and locations with high and continuous charging demand.
We observed that DC charging becomes the preferred choice in a growing number of public charging use cases, including destination, curbside, and en route highway charging, where maximum outputs can reach up to 300 kW currently. Only DC charging powers of around 100 kW and above enable a quick refill for driving distances greater than 50 km in an hour or less.
Norway, Singapore, the UAE, and Japan score high in the index for their public DC charging infrastructures, while the UK, Germany, and the group of Starter markets are AC-heavy beyond the main highway connections. Changing existing infrastructure to DC or creating a sufficient density of DC charge points will require significant investments in those markets over the next years. Starter markets preparing for the first wave of EVs can leapfrog to DC charging in public spaces.
6
GOVERNMENT READINESS
Subsidies directly impact EV readiness of a country
As seen in the customer readiness analysis above, price is the most important factor for customer decisions between ICE and EV. ICE vehicles have had a head start of more than a century in optimizing production at scale and in building an ecosystem, allowing customers to buy and operate vehicles affordably and conveniently. Therefore, legislators have introduced various EV incentives to compensate for economic disadvantages, which can be clustered into three broad categories:
- Sales price incentives (tax reduction or lump sum).
- Ownership incentives (mostly reduction of motor vehicle tax).
- Operations incentives (lower energy prices, reduced tolls, reduced parking prices/exclusive parking).
Our analysis shows that these incentives work in many countries. Especially when looking at the combined amount of subsidies from all three categories, shown in Figure 5, we see that the countries that have had higher subsidies for a longer time generally score higher in our overall ranking. Sales incentives are clearly capable of moving the entire EV industry forward.
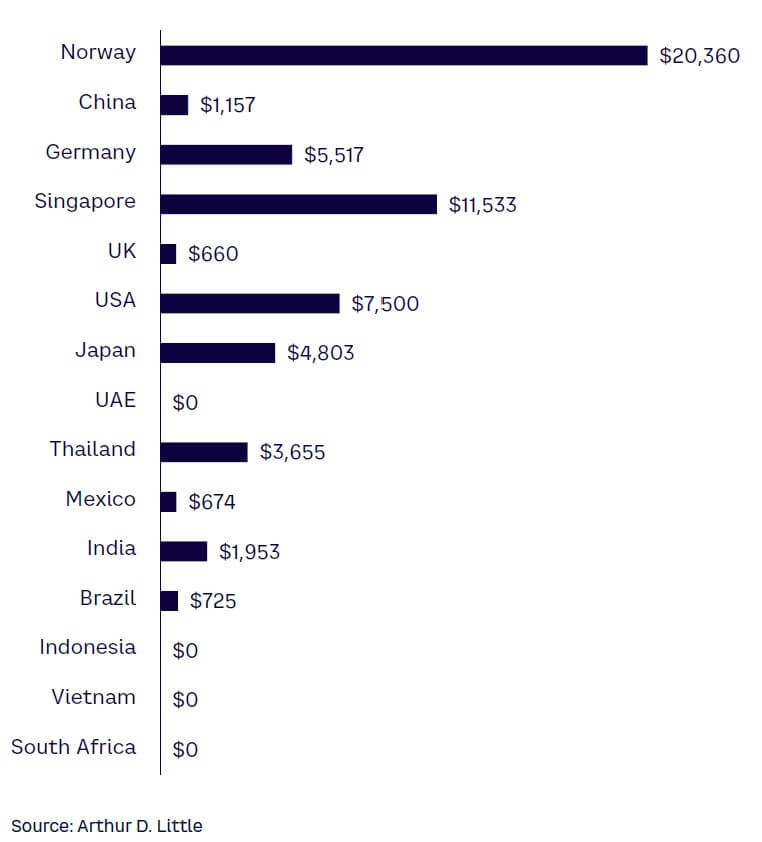
The prime example again is Norway. By waiving the value-added tax (VAT) on EVs, which is 25% in Norway, the end customer price for a new US $50,000 vehicle effectively falls to US $40,000 for a private customer. As a business, one could deduct the VAT anyway. Thus, EV adoption in Norway has been driven primarily by private customers, which has pushed the market forward and has allowed the overall network effects to generate advantages for commercial customers as well.
When it comes to commercial purchases, Singapore provides a flat rebate on EVs of up to US $15,000 depending on the model. Additionally, Singapore decreased tolls for EVs, making them not only more cost-efficient to buy but also to operate. Moreover, in some states of Mexico, EV owners are exempt from the “Tenencia,” an annual vehicle tax based on car value, amounting to savings of approximately US $850. Additionally, in leading EV countries, the costs of driving 100 km on fuel is nowadays comparatively higher than those of doing so on electricity, also due to taxes.
END OF FOSSIL FUEL ENGINES IN AUTOMOBILES
The roadmap is already defined: Norway will be the first country to ban the registration of new ICE passenger cars from 2025 onward (see Figure 6). In 2030, more markets we studied will follow, phasing out sales of traditional ICE vehicles (e.g., Singapore, UK). The last major global automotive markets like China, Germany, and Japan will follow in the 2030s.
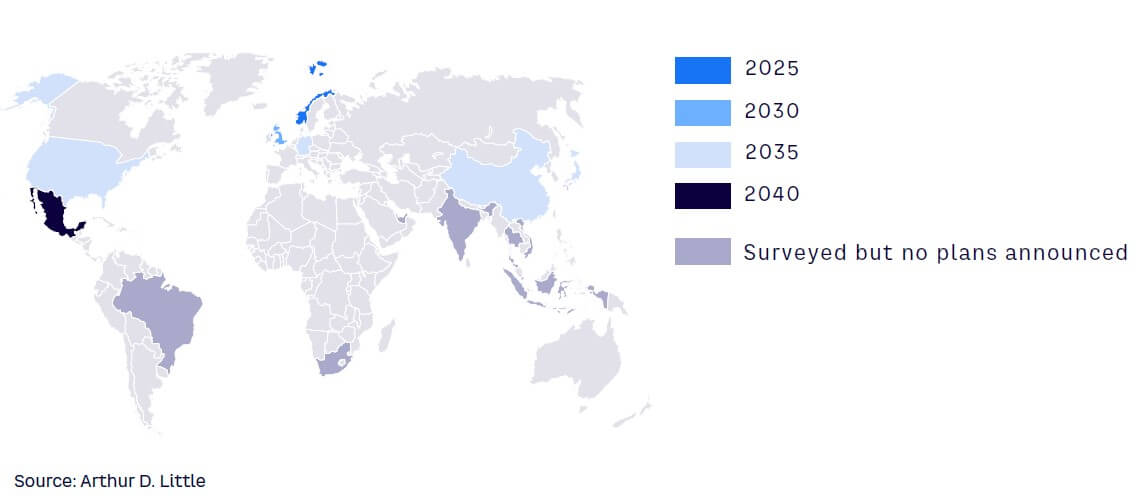
Meanwhile, regulators (e.g., in Europe) have also raised the technical standards for ICEs regarding emissions and fuel consumption. EURO VII emissions standards, for example, will bring the additional development and manufacturing costs for traditional powertrain components to levels that surpass those of electric powertrains.
Because ICE production volumes will decrease and electric powertrains will continue to become cheaper and cheaper, ICEs will be dead economically long before countries like France, Spain, or Portugal officially prohibit their sales in 2040. This will not even require global regulation: the tipping point is as close as one typical ICE generation lifecycle before the ban occurs in the big technologically leading markets like Europe, Japan, China, and the US. Thus, we expect the current decade to be the last in which we see significant amounts of new passenger ICEs being developed.
7
THE NEXT STEPS
What markets must do to become front-runners in e-mobility readiness
The die is cast for battery electric powertrains to be the main technology of the next 20-30 years in passenger engine vehicles, thanks to political agendas and the urgent need to flip transport markets from fossil fuels to carbon-free alternatives. However, both suppliers and customers will have a difficult time through the transition.
Norway, the front-runner in e-mobility, shows how long it may take to turn even a small market and vehicle fleet toward EV. Norway’s journey began in 2011, when EVs were rare and exotic, and the first Teslas were not yet in series production. Ambitious Followers and Starter EV markets of today will have it easier, as market conditions like model availability, TCO, and environmental awareness have improved on a global scale over the last 10 years.
Financial incentives for EVs or disincentives for ICEs may still be adequate support measures in a starting market. But in maturing EV markets globally, the true winning factors have changed: EVs, like ICEs, require a functioning ecosystem that must be holistically set up by multiple parties, as described below.
INFRASTRUCTURE
Formerly independent industries, such as vehicle OEMs, energy companies, road infrastructure and service providers, and telecom and software companies, need to work together with local and national authorities to provide widely available, easy-to-use, and reliable charging infrastructure for EVs. Only an integrated approach can ensure cost-effective and customer-oriented infrastructure development without jeopardizing grid stability and macroeconomic feasibility.
CLOSED-LOOP EV SUPPLY CHAIN
Successful EV markets will require a resilient, sustainable, and effective EV supply chain either domestically or in close reach. This involves the availability of raw materials, key components, and focal capabilities for EV. It will also necessitate a circular approach — reducing and reusing natural resources — to make e-mobility a truly sustainable alternative and to ensure supply of scarce inputs. Examples for this approach can be found in China, with hundreds of players in the EV area, but also Central and Northern European markets, which have discovered the attraction of domestic battery production and recycling. Southeast Asia, with automotive hubs in Thailand, Malaysia, Vietnam, and others, is already setting up to follow this EV cluster strategy.
MULTI-STAKEHOLDER ORCHESTRATION
Governments and regulators have played a central role in supporting e-mobility and will continue to do so. But they need to change their approach for the next act. EV infrastructure and supply chains are key prerequisites for successful e-mobility markets of the future. Both require holistic and integrated action from disconnected parties and market actors. This “garage band” needs a conductor to become a symphonic orchestra, and markets need more than tax incentives on one hand and restrictions on the other.
Corporate players, too, can assume the role of integrators. Markets in which either entrepreneurs or authorities successfully assume integrative roles in the areas of infrastructure and supply chains will become Ambitious Followers quickly, or even future leaders.
MARKET READINESS DIFFERENCES ATTRACT DIFFERENT PLAYERS
Leaders & Ambitious Followers
Mature EV markets like Norway, Germany, and China are at a stage that enables the entry of all kinds of EV actors, holding potential for established EV OEMs and scaled-up providers of charging infrastructure and ecosystem services. Customers in these markets appreciate a growing and still improving offering and have a rather high willingness and ability to pay — but also have high expectations. These markets are in rapid consolidation and market entry barriers for new entrants are high.
Emerging EV Markets
Players that still want to shape an EV market with new and selective vehicle offerings and charging infrastructure solutions will turn to Emerging EV Markets like the UAE or Thailand. These markets are not yet fully divided up among incumbents and are growing rather quickly — a very promising environment to scale up and to create a home base for later expansion or to enter for increased market share and dynamically growing revenues.
Starter Markets
Slightly late to the party, Starter Markets offer potential for new startup style entrants and for early infrastructure development in a “blue ocean environment,” where market shares are not yet divided up, but profit pools are limited and need to be developed first. These markets require patience and willingness to invest. Established players would rather wait for others to prepare the ground and make a late market entry with scale and financial power.
HOW ACTORS CAN COPE
Vehicle manufacturers
Manufacturers can adapt their offerings and supply chain planning to market readiness levels (e.g., in quantitative sales planning and product management).
In markets with higher index scores, such as Ambitious Followers, EV sales planning can follow proven methods, considering target segments, pricing, positioning, and product specifications. In addition, sales planners should note that powertrain disruption usually decreases brand loyalty. A convincing EV model offering helps to conquer market share and tap into new market segments, as demonstrated with examples such as Porsche Taycan and Hyundai Ioniq 5.
Starter Markets and markets with lower readiness, however, need special methods of sales planning and market entry. OEMs frequently prefer selective offerings, first targeting the most promising customer segments with lower risk. Sales planning must adjust to the fact that a new offering is only part of market preparation. It may, nevertheless, be more successful than expected due to the lower level of competition. As a brand, gaining market share with new EVs is even easier in a starting market than in more mature environments — at lower absolute levels.
Infrastructure providers
Norway and Ambitious Follower markets are experiencing consolidation of the charging infrastructure market. Players that have not yet pegged their positions — and established partnerships, customer bases, and solid market shares — should look for different environments. For incumbents, this is the phase for scaling and setting up fast public DC charging at attractive locations. Increasing utilization of charge points will be key. Public mega-watt charging for trucks and commercial vehicles will be the next big topic in more mature EV markets.
Infrastructure players in Starter Markets should avoid copy-and-paste strategies from early EV markets like Norway and not rely on the rollout of wide AC networks in the public space. Today, battery packs are bigger, BEV shares higher, and customers in many developing markets require public charging as they lack private parking and charging possibilities. Leapfrogging to quicker DC charging solutions at destinations and charging parks in fuel station locations may be strategy to avoid the need for additional investments in five years.
We expect today’s Starter Markets to develop EV readiness quicker than first benchmark markets and thus charging needs to catch up sooner rather than later.
GEMRIX 2022 METHODOLOGY
ADL’s Global Electric Mobility Readiness Index has been calculated for 15 countries in the current edition to make it easy to compare market data and metrices across different areas (see Figure 7). The index has been calibrated around a notional threshold value of 100. A score of 100 implies that the market readiness for e-mobility is on par with ICEs across relevant buying criteria, such as costs, utility, and availability. Thus, a score beyond 100 shows that EVs are even more beneficial than ICEs.
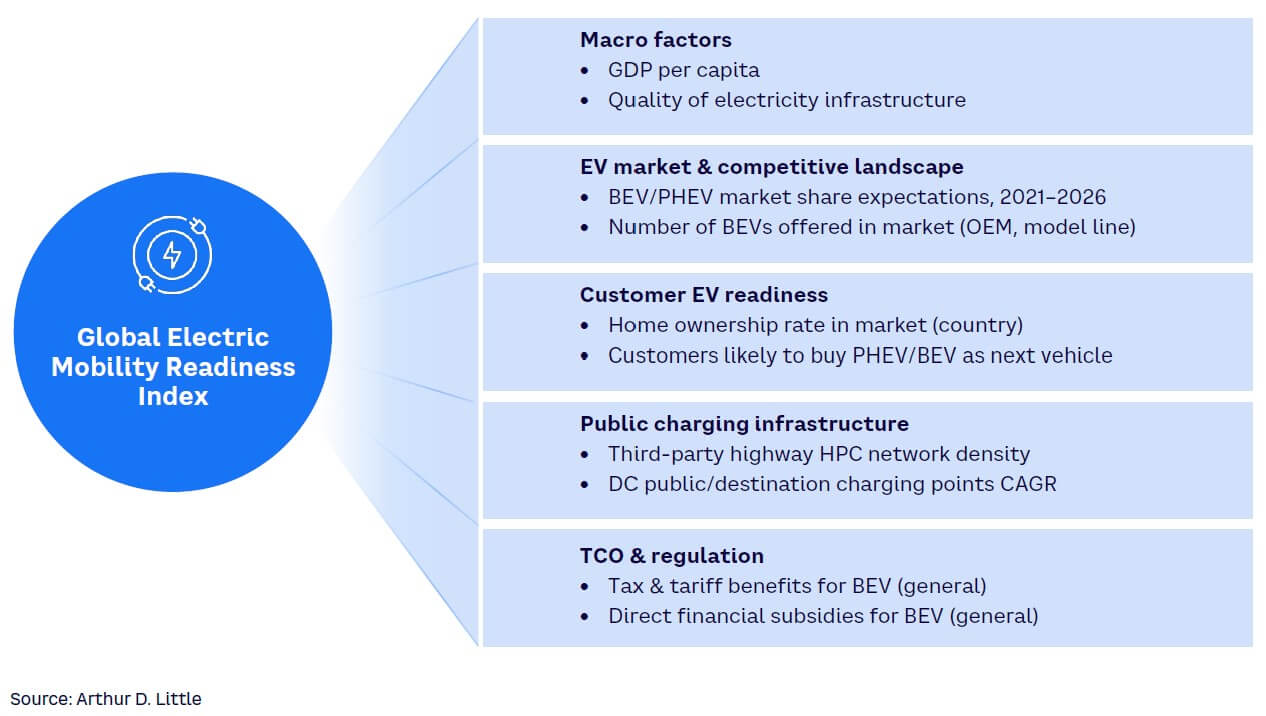
Market readiness is evaluated in five major categories that drive EV adoption: macro-economic market factors, EV market and competitive landscape, customer EV readiness, public charging infrastructure, and TCO and regulation. Each category consists of six to 15 specific data points that were analyzed with a standardized metric for each country, rendering a total of 45 variables per country.
The five categories were weighted according to their relevance for EV adoption. Markets can score a different number of points in each category, with each category varying by weight and depending on market data. The individual point score is calculated from analytics that consider relative and absolute performance measures. The final index score is the sum of performance indicators from the five subcategories, allowing for a detailed evaluation of a market’s e-mobility readiness.
#1 NORWAY
Leading in EVs and sustainability
Norway is leading the EV movement across the globe. More than 85% of new vehicle sales in that country have been PHEVs.[6] This adds to a long history of leadership in many sustainability areas. For example, the country’s utilities sector is mainly built on renewable energy from hydropower, with 45% of its energy mix coming from hydropower; the first hydropower plant was built in 1892. Moreover, 98% of electricity production already came from renewables in 2016.
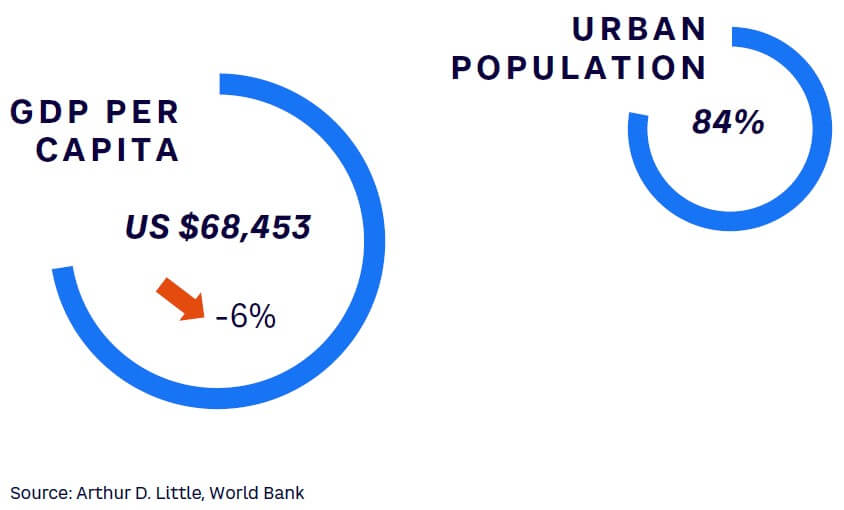
One driver for Norway’s EV adoption certainly is its high share of urban population. Of Norway’s inhabitants, 84% live in cities (see Figure 8). As a result, the usual range anxiety, a major inhibitor of EV adoption, is less relevant, since city driving covers fewer kilometers.
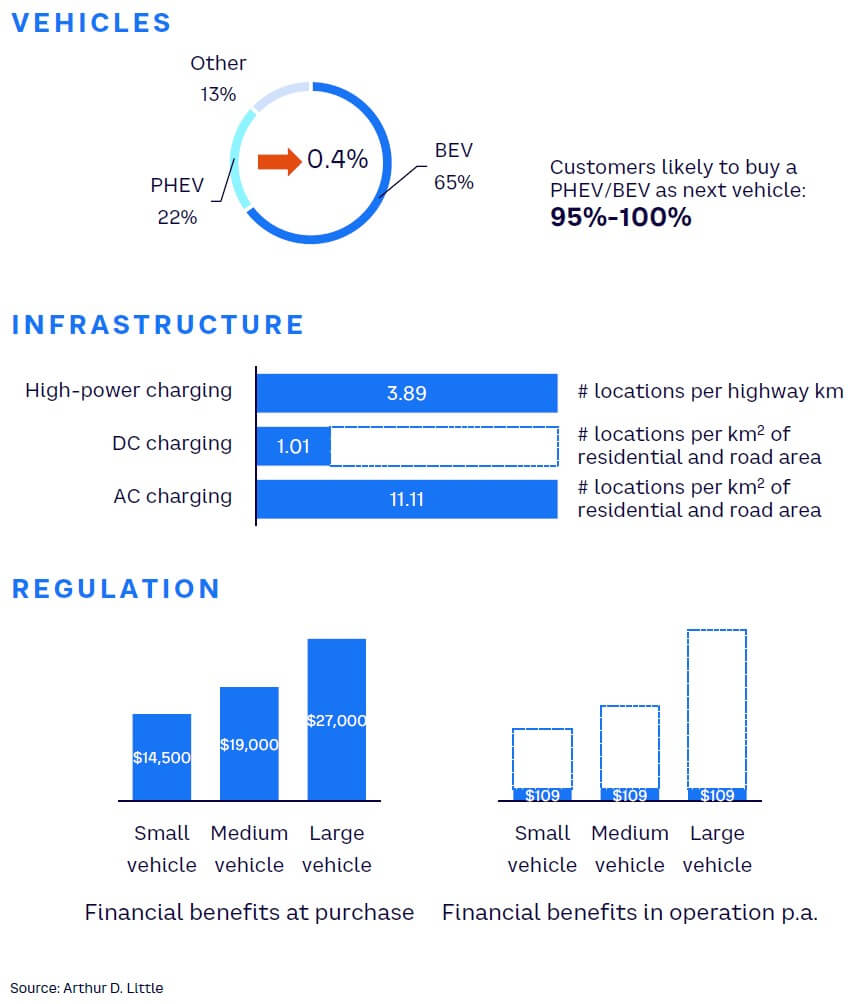
However, as Norway is a vast country, average trip length is high, at close to 15 km per day, on average. The government countered possible range anxiety by launching programs to install charging infrastructure as early as the late 2000s, resulting in investments of about 2,500 charge points by 2011 (see Figure 9).[7]
As Norway has historically not had a large car industry, automotive suppliers are currently flocking to the Nordic country. For example, battery cell manufacturers Freyr AS and Morrow Batteries have set up shop in Norway, and battery recyclers Swedish Northvolt and Canadian Li-Cycle are building plants in the country. The high availability of renewable energy for electricity-intense operations is the key driver of this development.
Norway’s government resolved the previously mentioned economic chicken-egg problem through government-funded infrastructure projects as well as tax breaks for EVs. As stated earlier in this Report, the 2,000 charge points were built through a program costing just €7 million. Furthermore, Norway committed to establishing chargers at intervals of at least every 50 km at major roadways, and successfully fulfilled that goal. To further accelerate EV adoption, Norway suspended import taxes on EVs in 1990, decreased annual registration taxes in 2000, and slashed EV VAT to 0% in 2011.
Its focus on cutting taxes paid off as EVs became the major technology in 2019 to reach a 50% share of sales, and pure BEVs reached 50% of sales in 2020.
Also, Norway has set ambitious goals for the future, declaring a target of zero local emissions from passenger vehicles by 2025. Putting this in perspective, the EU aims for a decarbonized mobility sector only by 2050. Moreover, Norway has set targets for 2025 that other nations have set only for 2030 (e.g., UK) or 2035 (e.g., Germany).
#2 CHINA
Strong local BEV ecosystem creating challenges for international OEMs
The EV industry in China is the largest in the world, accounting for about 57% of global production of EVs and export of around 500,000 EVs in 2021.[8] Plug-in electric vehicle (BEV/PHEV) sales amounted to nearly 15% of overall automotive sales in China in 2021, and these sales were driven mostly by local automotive companies. With China representing about 50% of the global BEV market, international OEMs must increase their value to customers and find cost-saving opportunities by designing vehicles to meet local requirements.
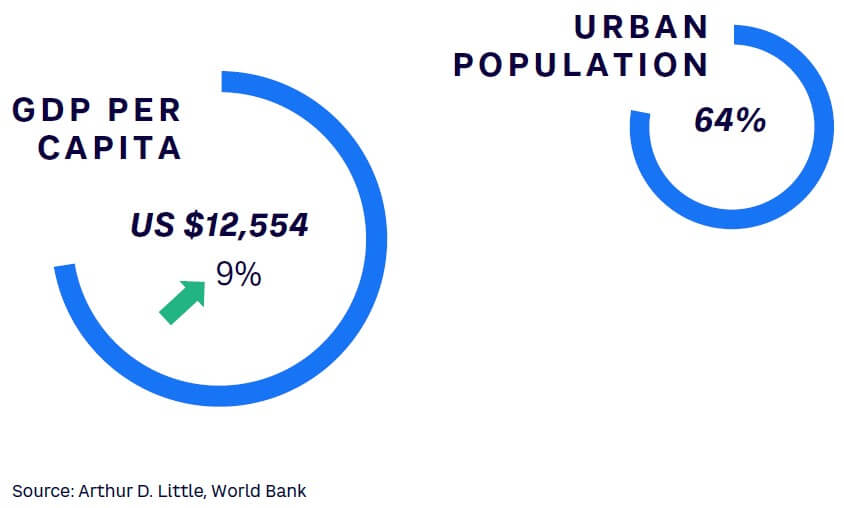
While global players are strengthening their technology position, they also need local ties to realize additional opportunities. Chinese OEMs like Xpeng, NIO, Geely, and BYD all saw record growth in EV sales in 2021. These regional companies are providing a superior customer experience to local consumers (see Figure 10 for a snapshot of China’s consumer population). Features such as strong human-machine interfaces and connectivity differentiate them from the competition.
With over 2.2 million charging stations throughout the country, China’s EV infrastructure continues to expand at an impressive rate (see Figure 11). With the successful transition to EVs so far, China’s charging network has grown in step with other technologies such as battery swap stations. As a result, it has established itself as the current leader in EV infrastructure.
Since 2019, China started a mammoth plan to add 600,000 charging stations. This robust foundation of EV infrastructure is playing a major role in the growth of EV sales at a CAGR of 18% over the coming years.
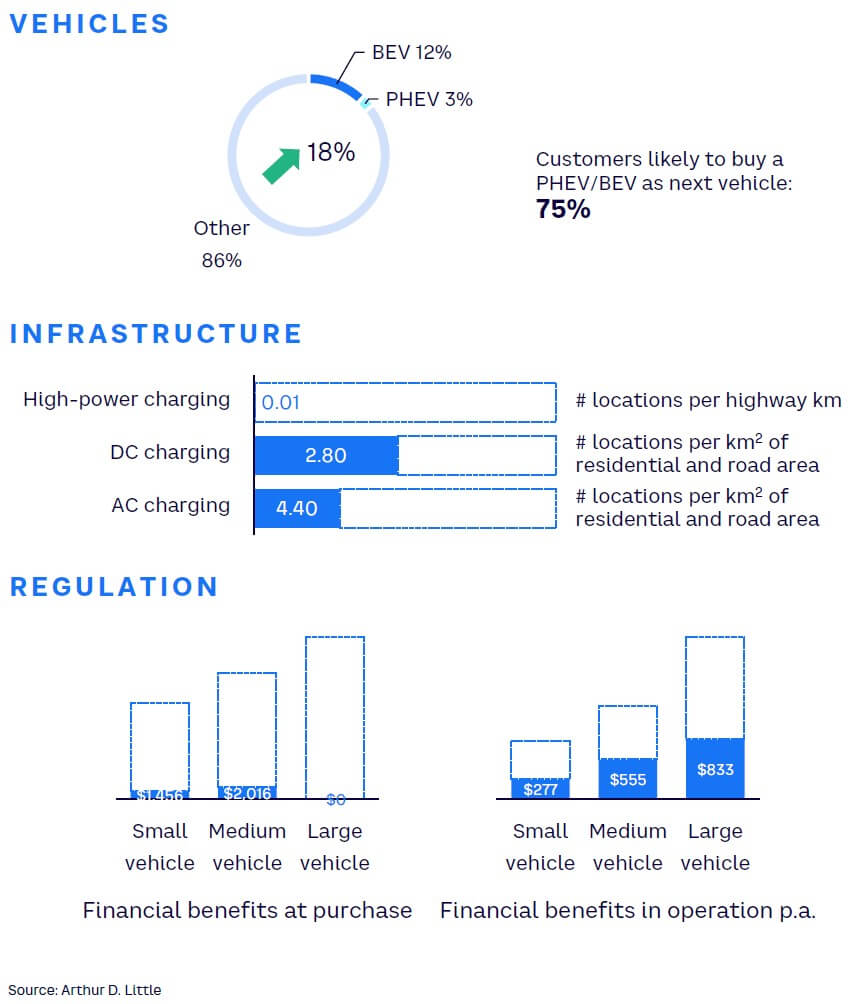
The Chinese government is supporting the development of the EV industry through regulation. There are encouraging policies and measures for both EV manufacturers and purchasers as well as incentives for business operators to engage in and improve charging and other peripheral services. Financial benefits for customers can range from around US $1,500-$2,000 per vehicle and about US $1,000-$1,500 for manufacturers.
#3 GERMANY
Strong automotive foundation thriving toward EV
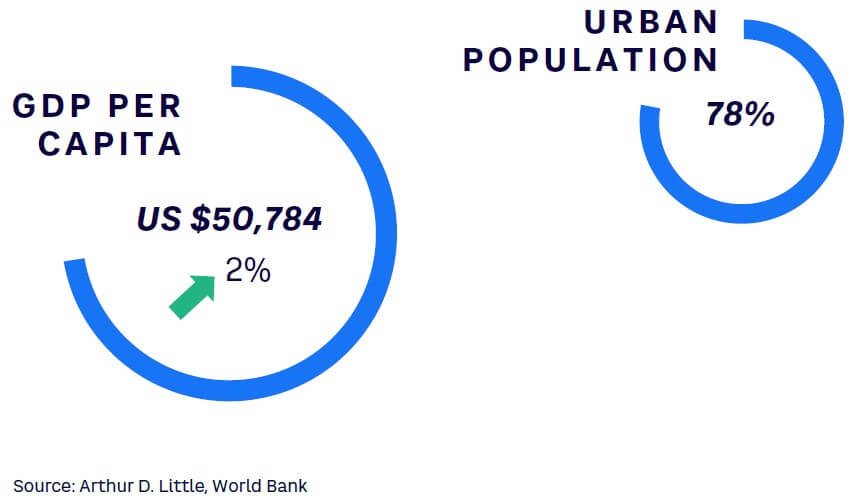
Germany has always been a strong automotive market, hosting many of the world’s most renowned brands, especially in the high-end sector. Comparing the number of cars on German roads to the population, statistically more than every second person owns a car in the country (see Figure 12).
Additionally, environmental protection has long played a significant role in Germany. The first legislation on the “Energiewende” (energy transition) dates to the late 1970s. Today, approximately 46% of electric energy is generated from renewable sources.[9] The current political uncertainties around energy import from Russia have prompted Germany to increase the local production of renewable energy even further.
The automotive industry in Germany, however, maintained a strong focus on ICEs for a long time. While the hype around EV from 2010 to 2013 was already high in countries like the US and China, German manufacturers only started serious production of EV passenger vehicles around 2019–2020. Despite the late start, German OEMs picked up the pace, and today, more than 70 different BEVs are on the market, representing a healthy mix of local and international brands (see Figure 13).
One of the major barriers to adopting EVs in Germany is the aforementioned chicken-egg challenge of consumer unwillingness to buy vehicles due to poor charging infrastructure and industry unwillingness to invest in infrastructure due to poor vehicle sales. Germany recently made a new attempt to break this vicious cycle with many new, attractive EVs coming to market spanning all price ranges. Many of these vehicles come with a free (or at least well-priced) wall charger, making EVs an attractive offer for the considerable portion of the population living in single-family homes with a parking spot.
Combined with the substantial financial benefits offered by the federal government, EV adoption increased significantly. This in turn made investment in public charging infrastructure attractive for players from the automotive, oil, and energy industries, as well as startups. Notably, German manufacturers’ sudden increase of vehicle models was also driven by the fact that other global OEMs threatened to take over this new market entirely.
Certainly, the newfound German appreciation for EVs also benefits from EU regulation like the announcement of banning registration of new ICE vehicles by 2035.
#4 SINGAPORE
EV sales boom in Singapore with new governmental measures
Singapore suffered a setback to increasing EV penetration during the pandemic but has bounced back sharply with new measures to promote EV sales.
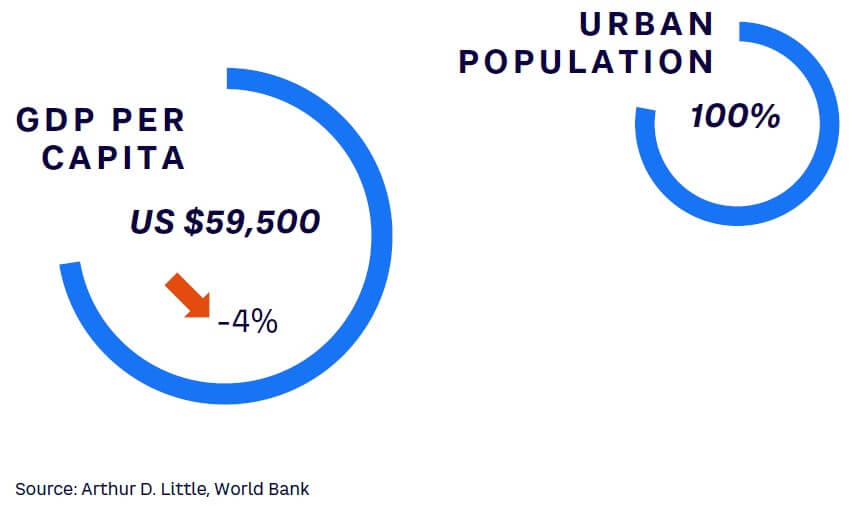
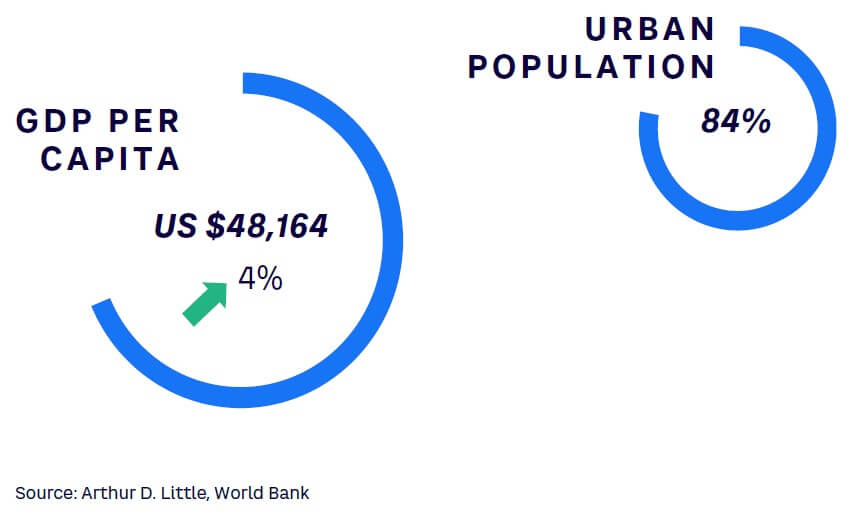
With a strong economy (an estimated per capita GDP of US $59,500) and almost 100% urbanization (see Figure 14), Singapore consumers are not anxious about driving range and are willing to pay a premium price for EVs, considering the manifold advantages. The government has also been clear about its encouragement of EV adoption through its announcement in March 2021 that all new car and taxi registrations will need to be clean energy models from 2030 onward, and that all vehicles on roads will need to run on clean energy by 2040.
EV sales are expected to continue to grow at an average annual rate of 40% year-on-year — to reach an annual sales volume of just under 7,000 units by 2030 and an EV-penetration rate of around 9.6% of total vehicle sales in the same year. (See Figure 15 for an overview of the EV market in Singapore.)
The Singapore government announced in its 2021 budget speech that US $25 million has been set aside over the next five years for EV-related initiatives entailing public-private partnerships. This could include measures to improve charging availability at private premises. Singapore will also accelerate the development of its charging infrastructure to better support the growth of EVs in the next decade, aiming to enable the rapid growth of EV sales at around 40% year-on-year. The plan is to deploy 60,000 charging points at public car parks and private premises by 2030 — more ambitious than the previous target of 28,000 chargers.
Financial regulations in Singapore are quite progressive as well. New policies such as the Vehicular Emissions Scheme, together with the EV Early Adoption Incentive initiatives, provide tax rebates to reduce the prices of some electric cars by up to US $15,000.
All these measures are motivating consumers and fleet operators to shift from ICEs to EVs as the transition becomes increasingly user-friendly and have put Singapore at the forefront of EV adoption across the globe and second only to China in Asia.
#5 UK
Fast acceleration with a promising future
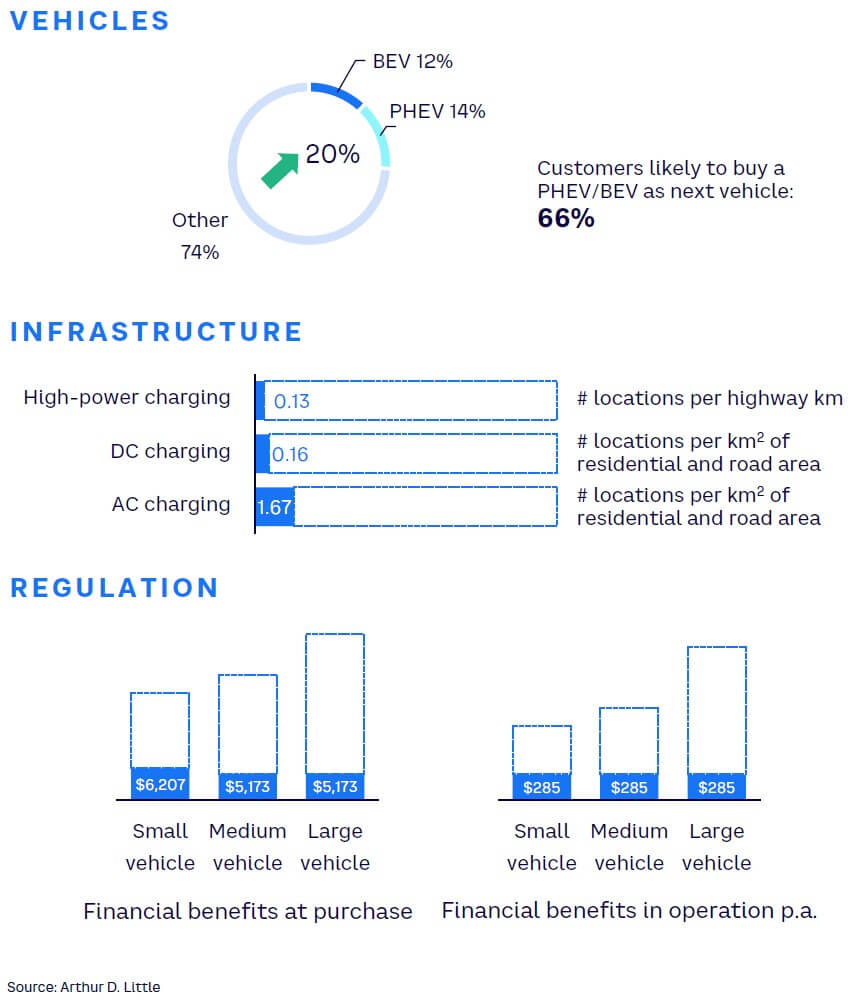
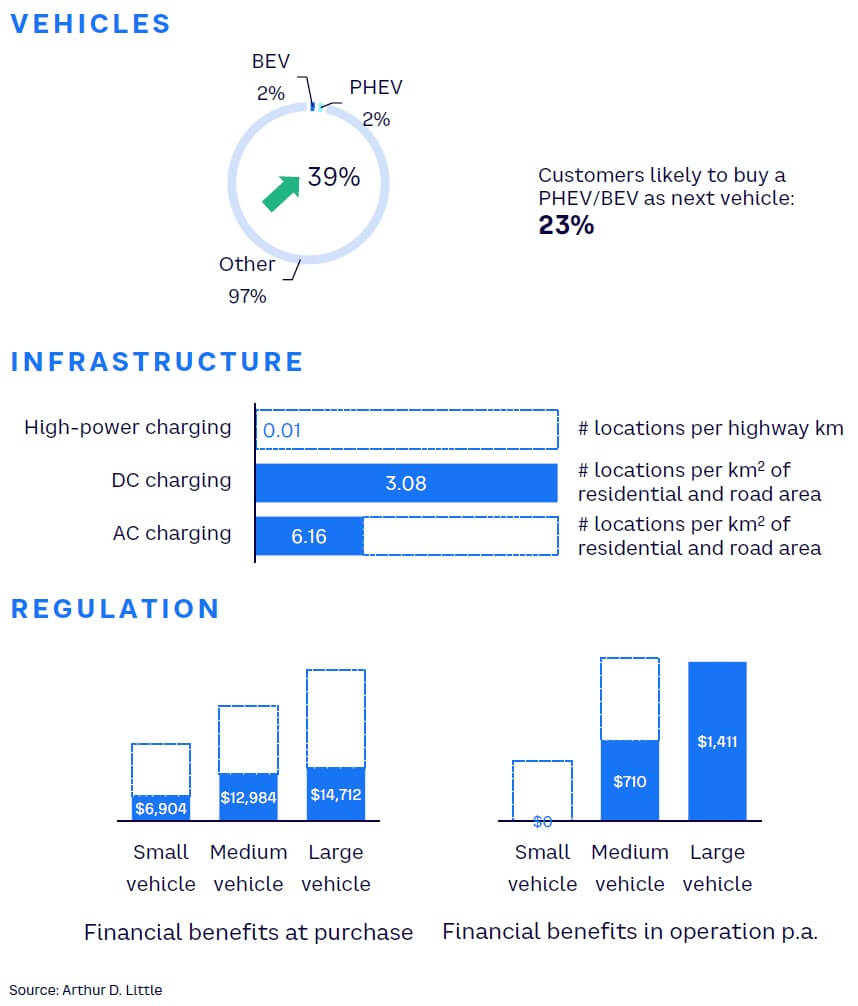
Electric mobility is slowly becoming a success story in the UK. In 2021, nearly one out of five vehicles sold were electric. The dominating technology is fully BEVs, as 12% of total vehicles sold used a purely electric drivetrain (see Figure 16). Since the COVID-19 pandemic, EV sales shares have skyrocketed and grew over the last two years at more than 56% per annum.
The UK government has set ambitious goals for building up its charging infrastructure. In 2021, the public and semipublic charging infrastructure stood at around 39,000 charge points, of which only 1,200 were less than 150 kW DC fast chargers. The country aims for at least six rapid charge points at every motorway service area by 2023.
By 2030, more than 2,500 high-power charge points are scheduled to be added across strategic road networks. In addition to its large public infrastructure program, the UK also subsidizes private home charging with a grant of up to £350.
One obstacle in the future might be renewable energy supply. With a renewable energy generation per capita of 1,782 TWh, the UK ranks last among developed countries (excluding Singapore). Moreover, only 17% of its energy consumption stems from renewables.[10] As the use of renewable energy sources is critical to EV sustainability, we see this as a development opportunity.
Governments and cities are endorsing EV uptake through bans and regulations on the one hand and incentives to empower end consumers on the other. By 2030, the UK aims to ban all new registrations of ICE vehicles. Furthermore, parts of cities are regulated through congestion zones in which vehicle operators must pay if emissions and traffic density standards are not met. For example, in London’s Ultra Low Emission Zone, petrol cars and vans must meet at least Euro 4 standards to avoid charges, whereas in Oxford’s Zero Emission Zone, every vehicle with local emissions is charged — even PHEVs. Additionally, EV purchase subsidies are in place for up to £1,500, as well as exemptions from road tax and an expensive-car supplementary tax. Further, the UK government also drives corporate promotion of EVs with a capital allowance and a benefit-in-kind tax. In total, we estimate that a battery electric company car has an advantage of more than £8,500 spread over three years over a similar ICE car.
In recent years, the UK has started to embrace the change from ICEs to EVs and is accelerating fast to nudge end customers in the direction of the electric powertrain. The steep increase in EV sales and the rapid buildup of infrastructure indicate its success. Furthermore, with Britishvolt entering the battery cell production business, the British economy is also likely to benefit from a more domestic EV supply chain.
#6 US
Robust government measures creating sustainable EV ecosystem
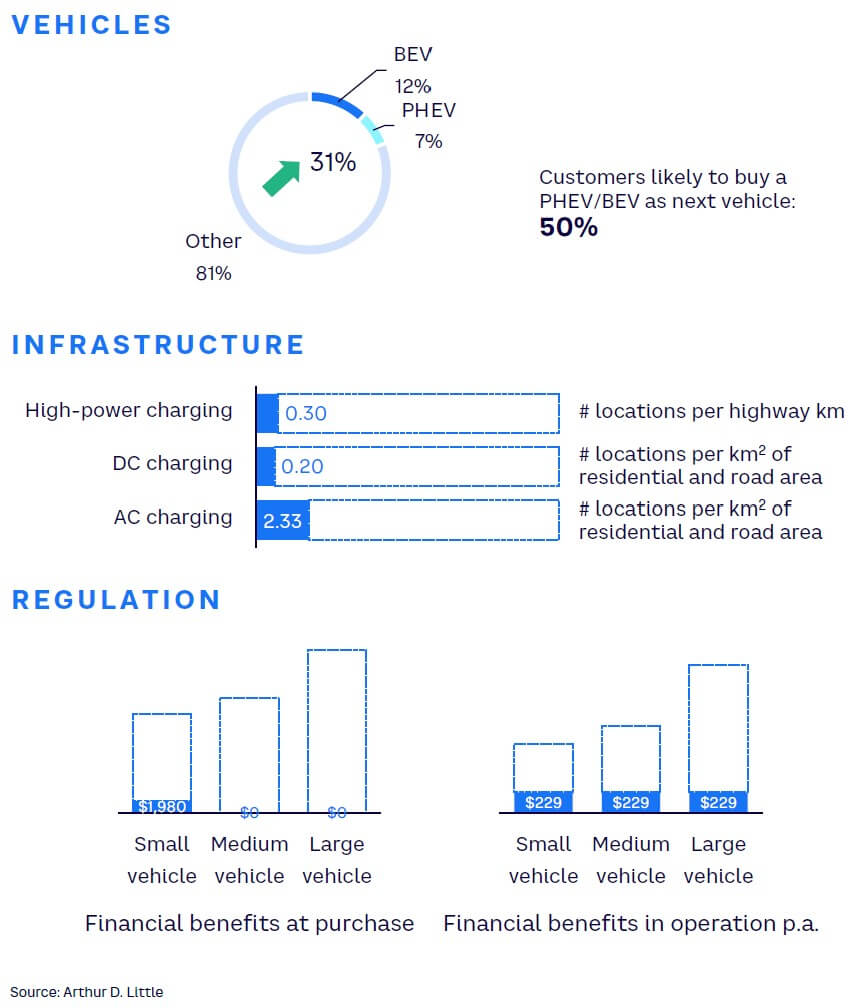
Until now, EV adoption has been slow in the US, where EVs have around a 4% sales share and only around 2.5% of vehicles are fully battery electric. Currently, only about 1% of the more than 280 million passenger vehicles in the country are electrified. As the US has always been a country of significance for the whole automotive industry, the developments will be exciting to monitor over the next years.
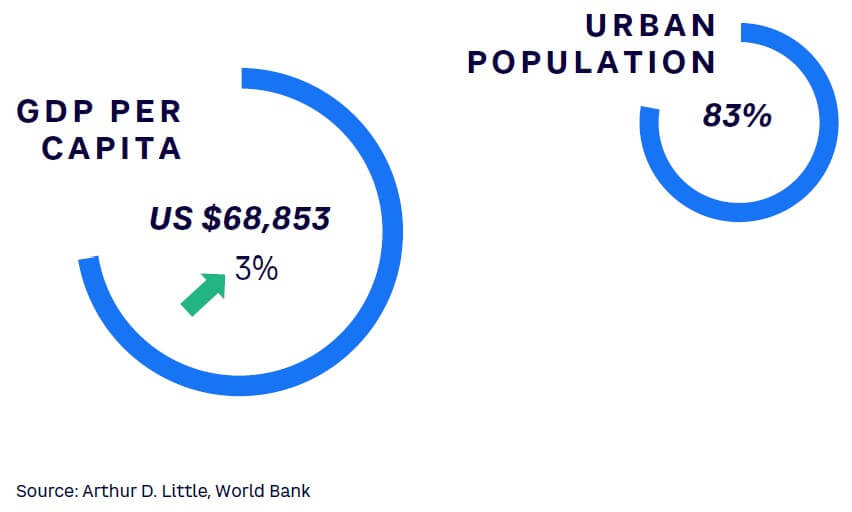
The US has favorable macro factors that are setting a promising framework for EVs: high GDP per capita at close to US $70,000 and 3% GDP growth over the last three years indicate adequate disposable income in many cases (see Figure 18). One of the highest motorization rates across the globe, with nearly 850 cars per 1,000 inhabitants, establishes the potential of the market.
High smartphone penetration of 82% and the third place in innovation index rankings also shows the US’s affinity for innovative technologies.[11]
However, a lack of infrastructure is a major inhibitor for now: charge point density on highways is very low, at approximately one or two charge points per 1,000 km (see Figure 19). The East and West Coasts boast better infrastructure than the Central and Midwestern states. Additionally, energy infrastructure might pose a problem for home charging, as residential homes are usually served by a single-phase power supply; only commercial sites have the three-phase power required for 22 kW chargers. This creates one of the largest challenges in the US, as range anxiety is the second biggest inhibitor with more than 25 km traveled per trip per inhabitant.
The rise of Tesla arguably kicked off the electric mobility movement across the globe and revived the US automotive industry. Tesla’s Model Y and Model 3 are the most popular EVs within the US. GM and Ford followed up on Tesla’s success by announcing ambitious EV sales plans. GM aims for 40% of global sales being electric by 2025[12] and 100% of passenger EVs by 2035 in the US.[13] Ford targets a 50% share of EV sales by 2030.[14] This led to more than 100 plug-in models available for purchase in the US in 2021. New market entrants are also flocking to the market, such as SUV brand Rivian and Lucid Motors. The automotive industries’ development is favorable, but thus far EV car sales have been driven mainly by pioneer customers and state regulation.
Low fossil fuel prices and a lack of charging infrastructure have so far counteracted wider EV adoption.
Encouragingly, the current US government has announced more ambitious plans. In 2021, it declared the goal of 50% of sales being of EVs by 2030, with the addition of 500,000 new charge points. It backs up these claims by subsidizing EV purchases with tax credits of up to US $7,500 and a fund for infrastructure rollout, including US $5 billion for the installation of chargers. These developments make the US one of the most attractive countries for EV players in the next years.
#7 JAPAN
A potential not yet exhausted
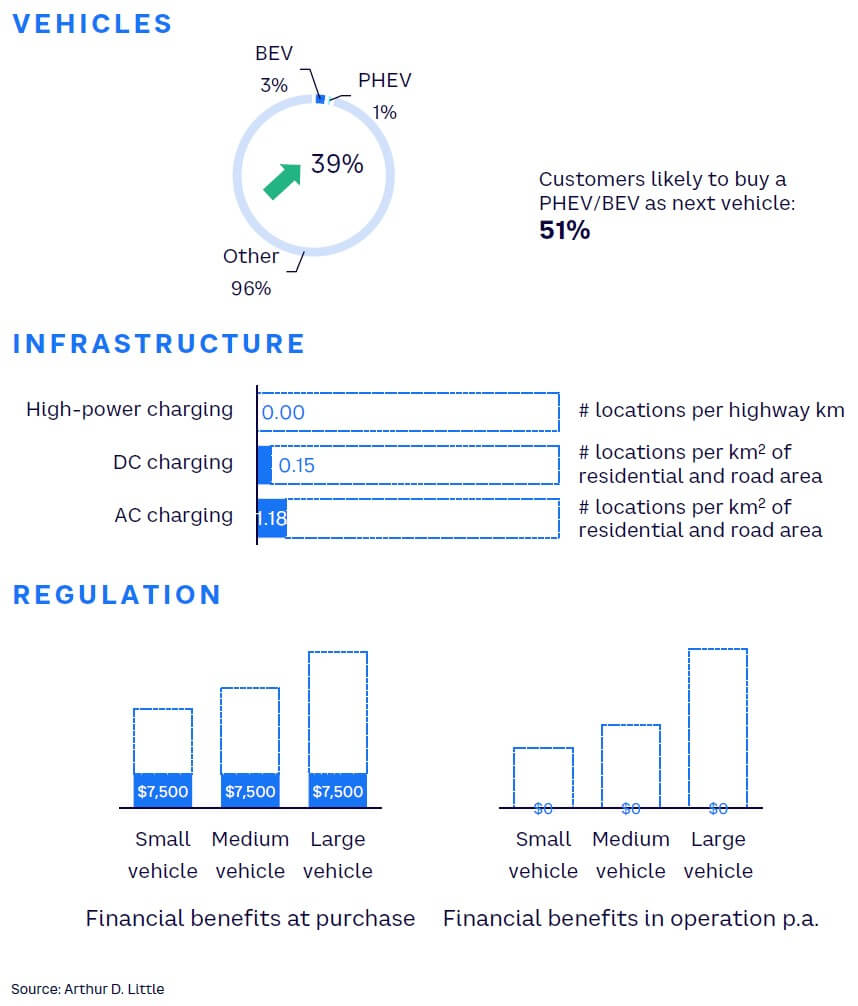
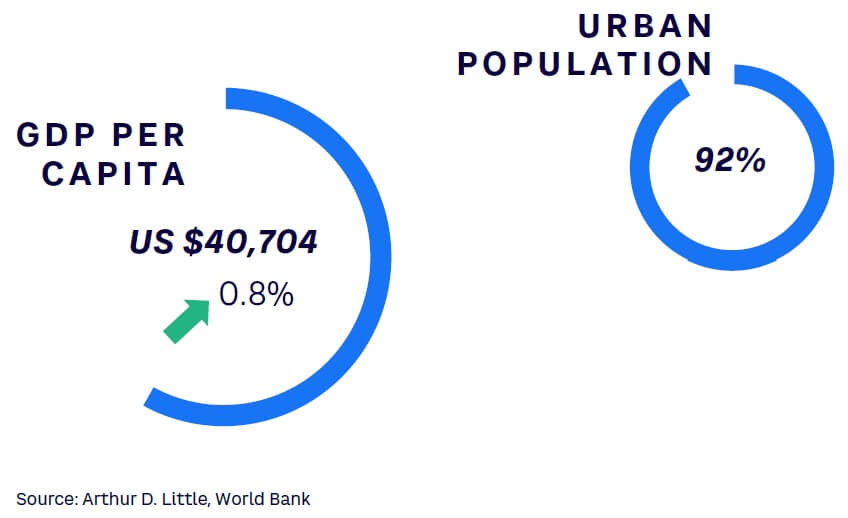
EV sales as a percentage of total auto sales for Japan were below 1% for 2021, with an estimated annual sales volume of about 42,000 units. However, while EV adoption has been low, recent initiatives taken by the government and OEMs are expected to bring a much-needed boost to electrification. (See Figure 20 for a snapshot of the population of Japan and Figure 21 for an overview of its EV market.)
In 2021, the Government of Japan set a target for all new cars sold by 2035 to be environment friendly, which will push EV sales. The government has also subsidized part of the cost of purchasing EVs, particularly BEVs, PHEVs, and fuel cell EVs (FCEVs). Local automakers such as Toyota, Suzuki, and Honda have plans to expand their EV offerings in 2022, increasing supply in the market.
While PHEVs and BEVs have not seen high adoption in the country, hybrid EVs (HEVs) are quite popular, with more than a 30% share of total auto sales. Japan also has a strong EV charging infrastructure, with about 30,000 charging stations, and the government plans to increase the number to 150,000 by 2030. With a strong mix of urban population and regulatory push, Japan is slated to become one of the bigger EV markets globally.
Japan’s laggard approach to e-mobility is largely due to its huge investments in gasoline-electric hybrids. Nissan Leaf is the only successful BEV currently operating in the country. Thus, both the government and Japanese companies have good reason to hold their bets on EVs.
Today, Japan dominates the global market for the current generation of gasoline-electric vehicles. Given customers’ familiarity with this technology, their preference to shift to PHEV/BEV is far lower than that in other developed nations. More than 30% of all vehicles sold in Japan are HEVs. After incentives provided by the Japanese government in 2012, electric charging infrastructure developed rapidly in the country, with more than 30,000 stations already operating. As demand for HEVs continues to rise, the EV charging infrastructure will further improve. The government provides subsidies at the point of purchase for EVs but no such incentive is currently provided for operating such a vehicle.
As the EV space continues to evolve, Japan will surely move to avoid being left behind.
#8 UAE
Strong infrastructure push by government will push EV adoption
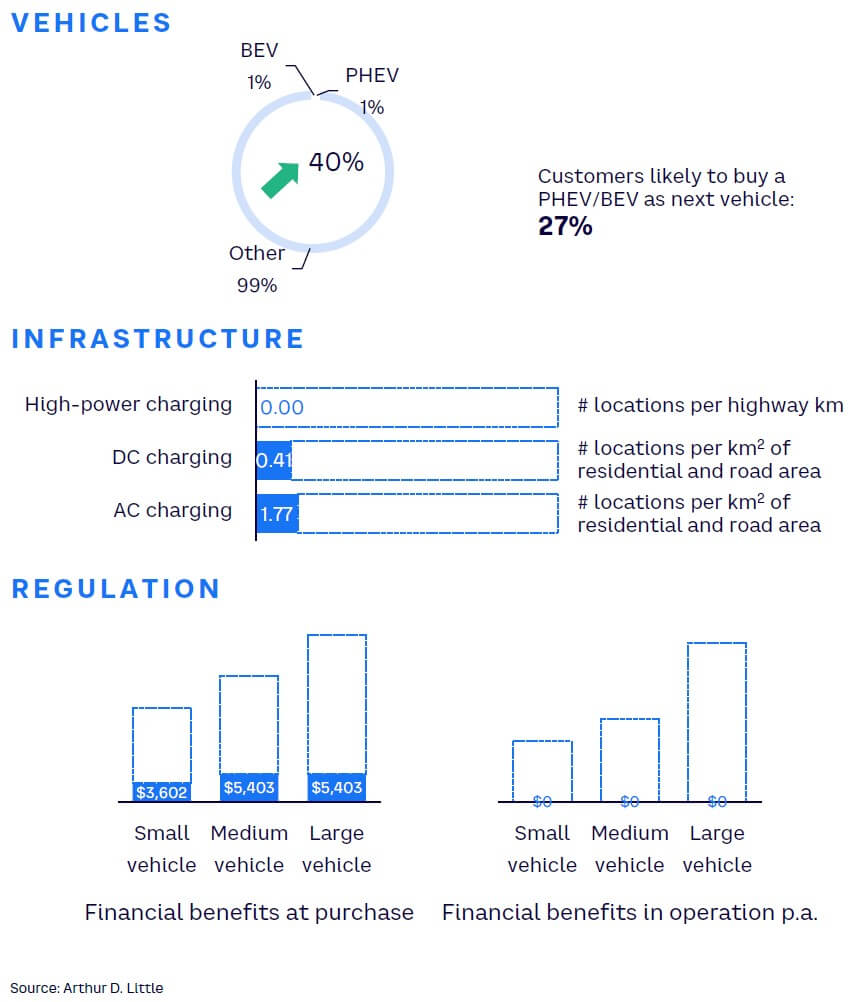
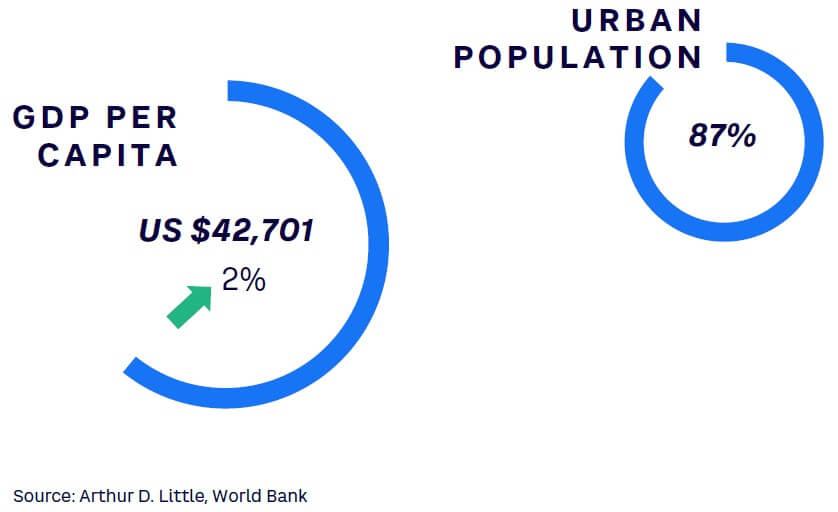
The UAE EV market is currently in the early stages and forecasted to grow at a CAGR of 30% between 2022 and 2028. Passenger vehicles constitute around 95% of the EV market in the UAE due to an increase in rental car services and the limited scope for commercial vehicles in transport and logistics. (See Figure 22 for a snapshot of the UAE population and Figure 23 for an overview of the EV market.)
Under UAE Vision 2021, the government has promoted EV adoption across the nation. It has converted 20% of government agency cars to EVs and further intends to reach 42,000 EVs on the streets by 2030. The UAE today has one of the biggest charging-station-to-vehicle-ratios in the world. Dubai’s EV Green Charger initiative was launched in 2015 to increase the number of charging stations. Since then, the network has expanded and, as of this writing, the country has 325 charging stations.
To promote the use of EVs, Dubai Electricity & Water Authority and Road Transport Authority are working jointly on incentives like free parking, exemption from toll, and reduced registration fees. They aim to make public transport emission-free by 2050.
The region’s first EV and battery logistics hub has been opened in Dubai’s Jebel Ali Free Zone, in line with the UAE’s transition to a circular economy by ensuring a reliable supply chain for sustainable mobility solutions.
Around 30% of UAE residents would consider buying an EV to contribute to the green transition and believe that they offer better value for money than traditional vehicles in the long run.[15]
People in the age group of 20-25 are more likely to be influenced by environmental factors and can be the youngest potential adopters. There have been hefty investments to reduce the charging time of EVs, providing further incentives for consumers to adopt EVs.
#9 THAILAND
Strong stakeholder engagement driving EV adoption
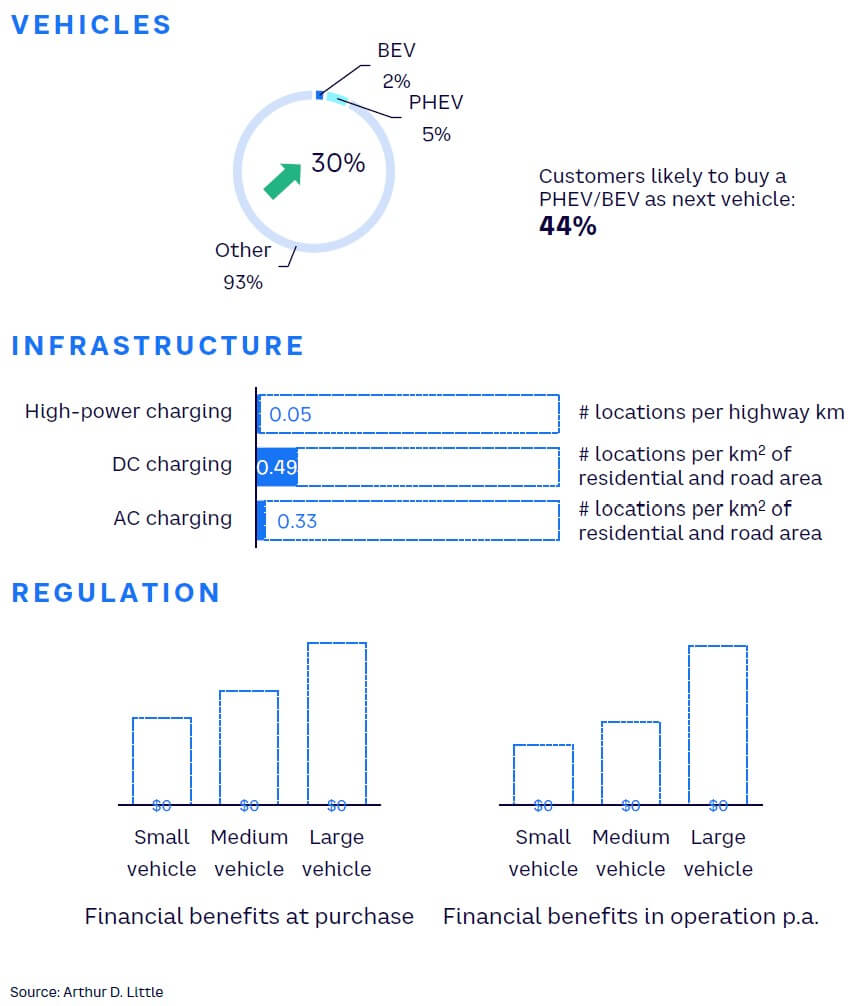
Often referred to as the “Automotive Hub of Asia,” Thailand has witnessed the flourishing of its automobile industry over the years. The industry contributes significantly to its GDP. (See Figure 24 for a snapshot of the Thailand population.)
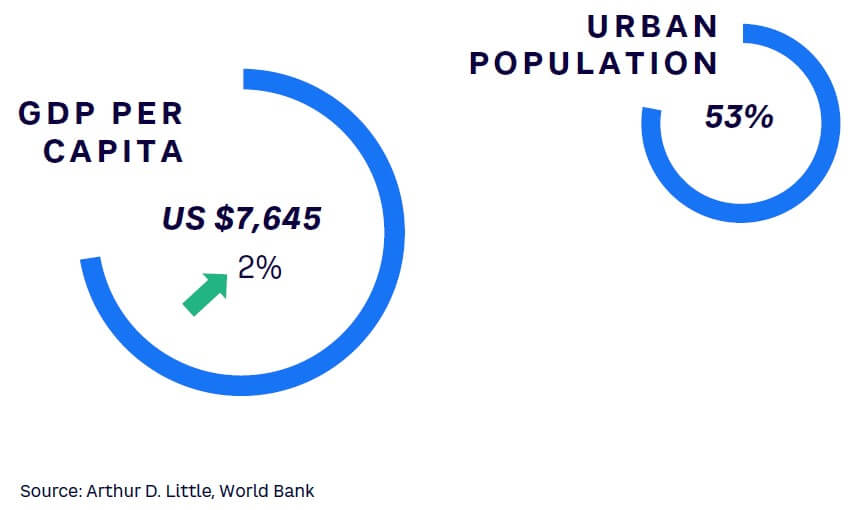
At present, EV penetration is low, but it is encouraging to note that almost half the population would prefer an electric vehicle in the years to come (see Figure 25). To sustain this enthusiasm, Thailand will need active government intervention and stakeholder engagement. Recent progress is noteworthy. There has been a concerted push to fast-track EV adoption in the country. State-run companies, academic institutions, government agencies, and automotive associations are taking the lead in electrifying the vehicular fleet, particularly in the area of public transportation.
The Thailand government has planned consistent efforts for building the country’s charging infrastructure. The Ministry of Industry, for example, targets the setting up of charging stations within a maximum 50- to 70-km radius in the years to come. To bolster this, three state enterprises — Electricity Generating Authority of Thailand (EGAT), Metropolitan Electricity Authority (MEA), and Provincial Electricity Authority (PEA) — have joined to support investments in EV charging infrastructure.
With EGAT, the Ministry of Higher Education, Science, Research and Innovation and several academic institutions have collaborated to form the Thailand Energy Storage Technology Alliance (TESTA), which has the objective of revolutionizing local storage technology, a key pillar of electric mobility.
Thailand, therefore, is set for accelerated growth in EVs in the next five to 10 years, with increased investments from local and Thai investors coupled with government incentives. The government’s National Electric Vehicle Policy Committee has set the target of EV sales penetration at 30% by 2030.
#10 MEXICO
Urgent need to tackle rising pollution propelling EV push
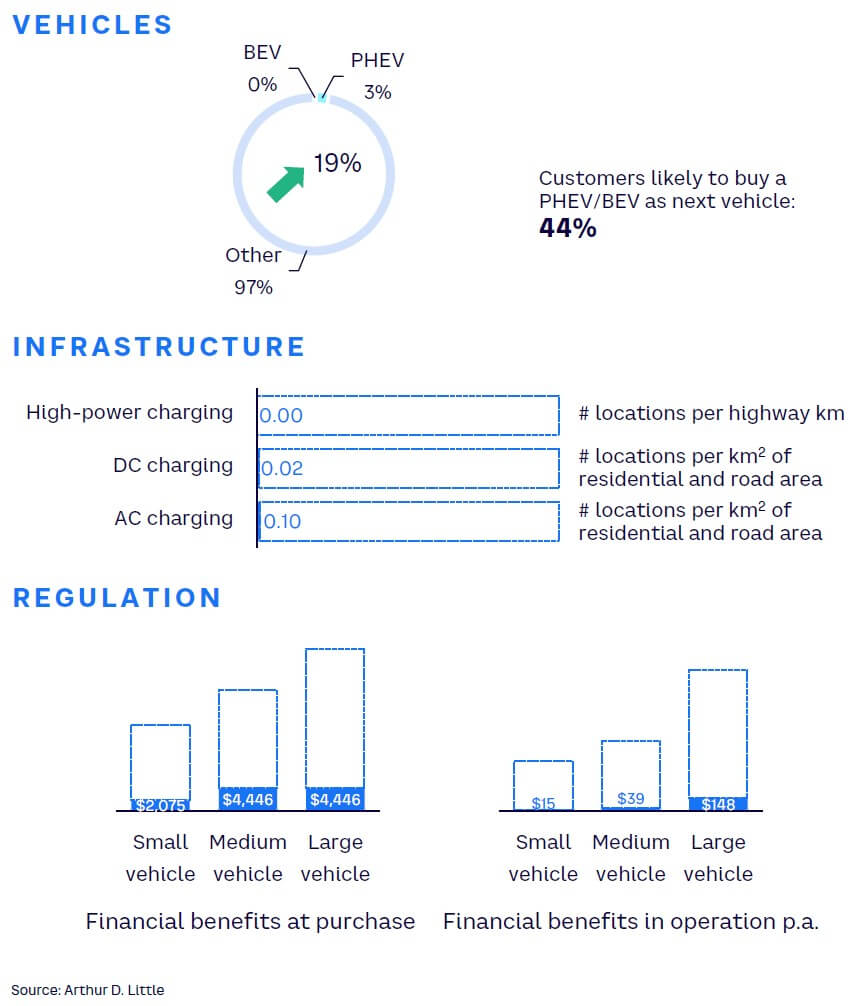
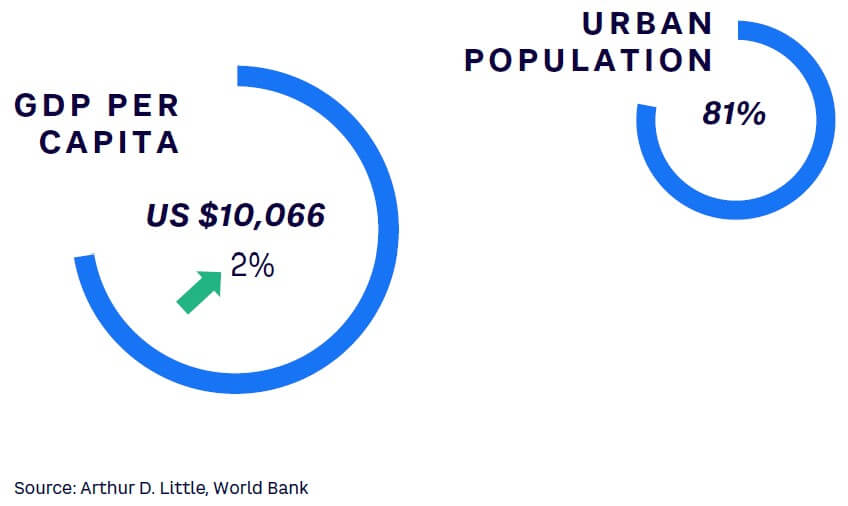
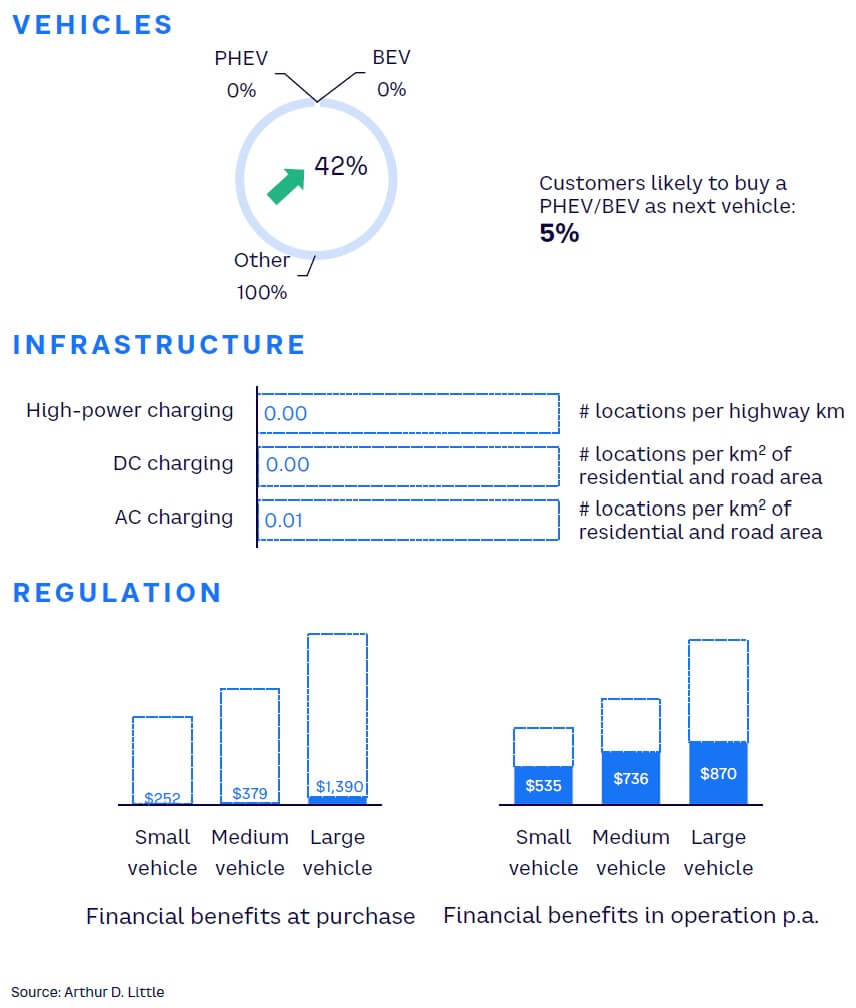
Among the most populous countries in the world, Mexico is riddled with high travel times and air pollution. While the solution to both problems lies in electric mobility, only 5% of consumers would prefer an EV in the years to come.[16] Government incentives and private investment are required for a strong push toward electrification of the Mexican fleet. (See Figure 26 for a snapshot of Mexico’s population and Figure 27 for an overview of the country’s EV market.)
Understanding the criticality of its role, the Mexican government has developed a roadmap for electric mobility. Municipal tax exemptions and pollution control inspections are incentivizing locals.
Further, gasoline prices are on the rise, which has further bolstered sales of electric and hybrid vehicles. Private automotive players such as BMW and Nissan are making inroads in the country as well.
However, a lack of large-scale government support and limited charging infrastructure are key concerns. For each charging point in Mexico, there are 31 EVs, which is a dismal number compared to the EU average of 13. Moreover, the charging points are concentrated in smaller pockets, so there is an additional challenge for widespread access.
Notably, Mexico City is part of the Zero Emission Bus Rapid-deployment Accelerator (ZEBRA) initiative, focused on zero-emissions public transport in mainstream cities across Latin America. While infrastructure is a challenge, there is a clear understanding of the need for EVs in Mexico.
The future is encouraging, with General Motors announcing plans to infuse more than US $1 billion in an EV plant that will commence commercial production in the beginning of 2023.[17] This investment also envisages capacity for battery packs, electric motors, and other components, and is the first of its kind in Mexico.
#11 INDIA
Strong government push driving EV adoption
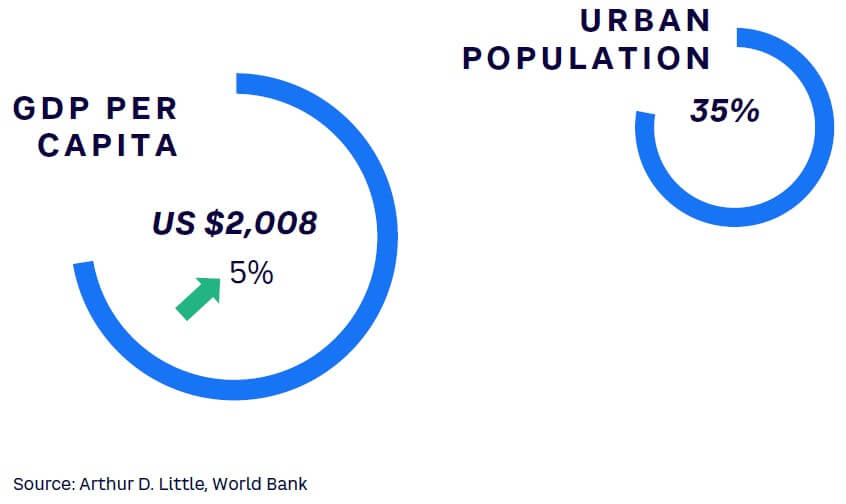
India is uniquely positioned in the EV space, with high customer adoption in a few segments. The current penetration rate of less than 1% is not encouraging, but given the country’s ambitions and capacity commitments, it might turn out to be the dark horse in the EV race. (See Figure 28 for a snapshot of the population in India and Figure 29 for an overview of its EV market.)
The Indian government’s Faster Adoption and Manufacturing of Hybrid and Electric Vehicles II (FAME-II) policy is one of the most important regulatory factors driving the EV push. Although current EV infrastructure is barely present, both local and global players have placed big bets on setting up adequate EV infrastructure in the coming two to three years. A rising middle-class population, government’s push to reduce carbon emissions, and increasing fuel prices are some other factors driving EV adoption.
However, EV adoption has been higher for two-wheelers and three-wheelers in India in comparison to passenger cars, which have not had much traction. A lack of proper road connectivity, long charging times, and infrastructure constraints have funneled penetration in favor of two- and three-wheelers in the country.
The Indian government is providing several financial incentives to OEMs in EV manufacturing, which have been passed down to customers at the point of purchase. However, the lack of adequate charging infrastructure has restrained customers from shifting toward EVs, which is usually a preferred second car choice for aspirational consumers in the country.
A lot of nonfinancial incentives have been provided for EVs, which has further spurred adoption. Given India’s demographics, the shift will, however, be led by the metropolises of Delhi, Mumbai, Bengaluru, and Chennai before it eventually trickles to other parts of the country. The lower cost and a preference of customers to travel smaller distances on bikes have led to faster adoption of two-wheelers. Players like Ola and Ather have already sold out their first batches of EV bikes, and large OEMs like Hero, Honda, and TVS have shifted their focus to two-wheelers as well.
India’s prominence in the global space is reflected in its mission to play an important role in the EV space. It remains to be seen if plans put in place materialize soon for the country to achieve its targets.
#12 BRAZIL
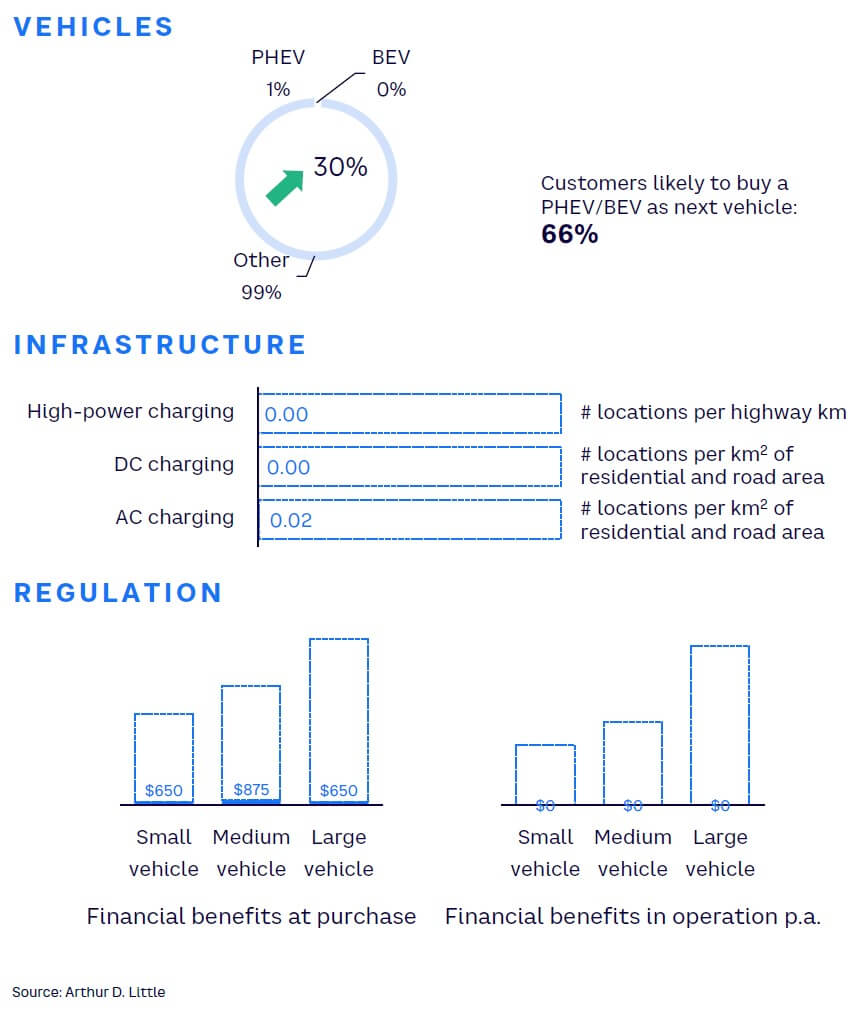
Rising fuel prices, cost of ICE vehicles not enough to spark Brazil’s EV market
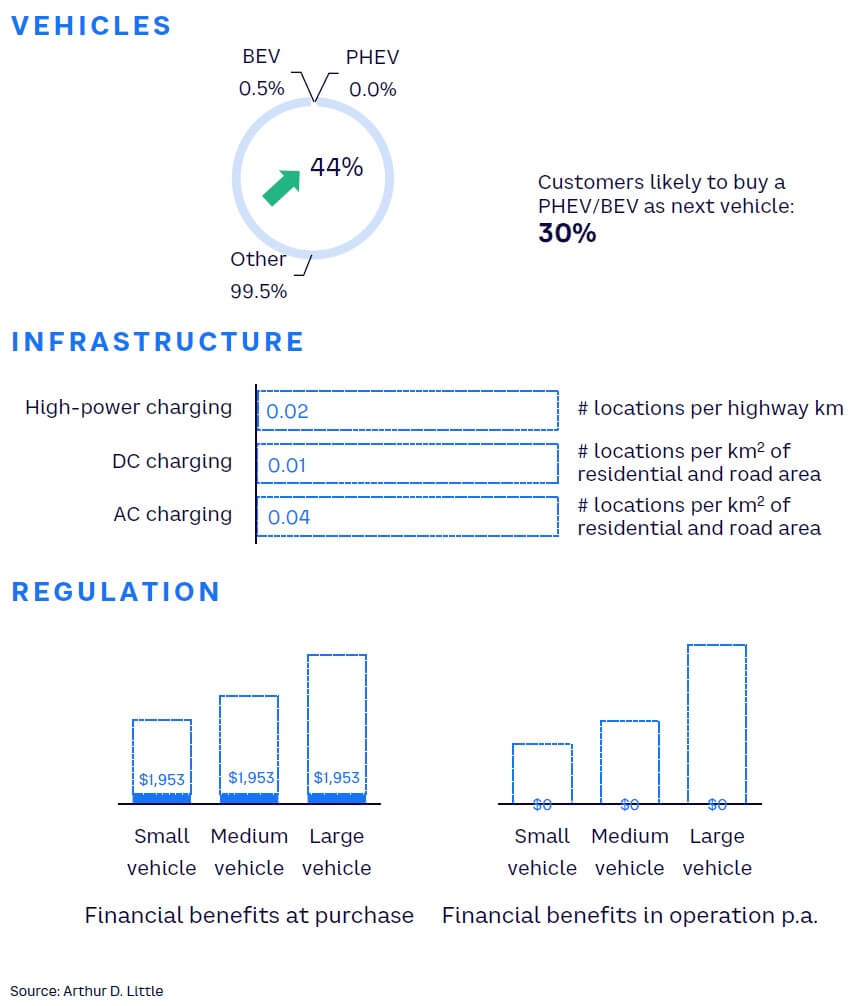
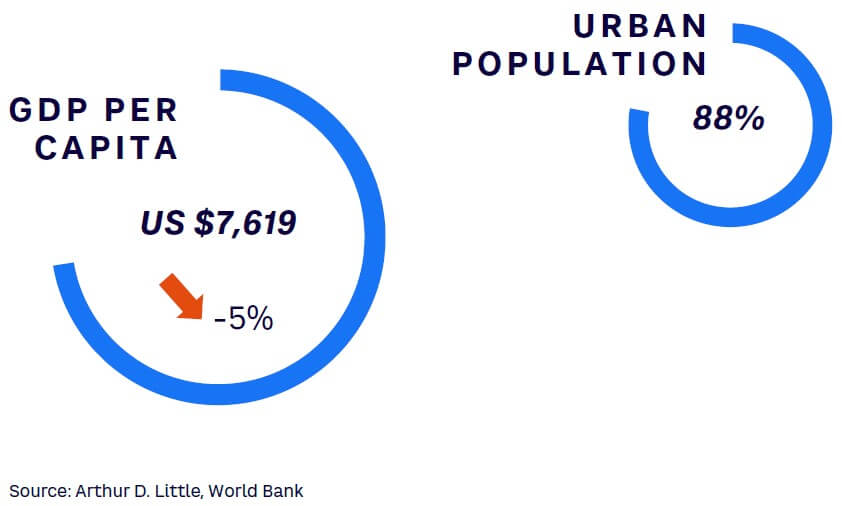
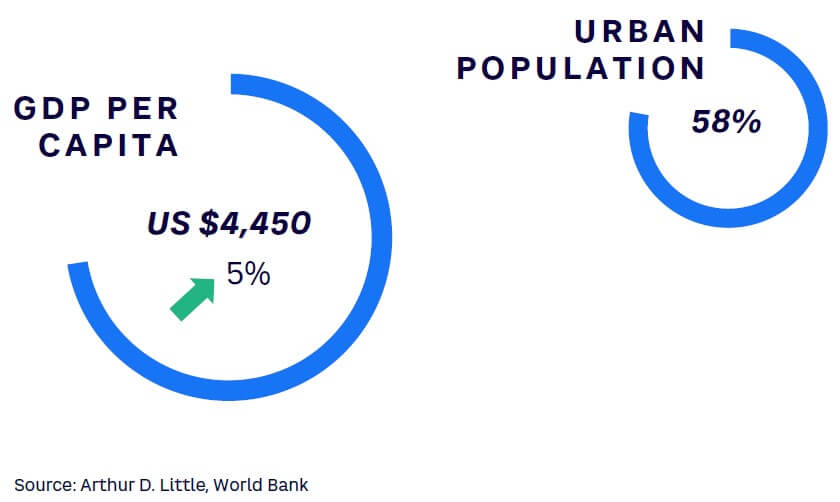
A developing economy that has seen one of the lowest GDP per capita growth rates during the pandemic (-5%), Brazil is far behind other nations in EV adoption. Fuel prices are surging at the rate of 44% year-on-year in 2021,[18] but despite the increased costs, the Brazilian government has not been able to shift the momentum toward EVs. (See Figure 30 for a snapshot of the Brazil population and Figure 31 for an overview of the EV market.)
Awareness of the problems from ICE vehicles in terms of pollution and emissions has been growing among consumers.
However, limited spending power and sparse charging infrastructure has hamstrung adoption of EVs.
The key reason for the government’s inability to shift its focus to EVs is the country’s success in reducing its carbon footprint using biofuels. Brazil is planning to explore more opportunities for sustainable vehicles using biofuels. Apart from this, the nation cannot shift abruptly to BEVs, as current consumers are unable to afford them and investment in recharging infrastructure is uncertain on the part of governments and OEMs.
Only around 1% of cars on the road in 2021 were hybrid or electric. The modest figure is mainly due to high acquisition costs and the lack of infrastructure, as the vehicles depend on supply networks and specialized chains for maintenance. A lack of regulation and of a national consensus on the role of EVs have been notorious in the nation, so there is no dedicated charging infrastructure in place. And few OEMs are willing to tackle the high investments and risks of the new infrastructure required for adapting manufacturing plants to BEV-native architecture.
That said, recent government measures in terms of financial benefits have sparked a hope for growth of EV, with 68% of consumers saying that their next vehicle is likely to be electric, as reported by Statista. Brazil’s biofuel ecosystem for vehicles will determine the path for electromobility in the long term, and the nation must expedite its policies to compete with similar and developed economies across the world.
#13 INDONESIA
Strategic advantage and incentives sparking EV push
Indonesia holds one of the largest nickel reserves in the world, a key component of the lithium-ion battery cells driving the EV revolution. This gives the country a major strategic advantage in EV expansion.
As part of its EV roadmap, the country seeks to become a major EV market by 2030. (See Figure 32 for a snapshot of the population of Indonesia and Figure 33 for an overview of the EV market.) To this end, the Indonesian government has introduced various incentives, such as the Positive Investment List (PIL), which promises a host of incentives for companies making investments in the EV space.
These incentives include ease of license procurement, coupled with lucrative tax incentives such as a 0% tariff on luxury vehicles that adhere to zero-emissions technology standards.
Additionally, the country is witnessing aggressive urbanization and an increasing share of youth among its population. Hence, the environment is conducive to rapid expansion of EVs; still, there needs to be a consistent infusion of capital, time, and efforts. According to the Coordinating Minister for Maritime Affairs and Investment Luhut Binsar Pandjaitan, Indonesia requires US $35 billion to build and scale its EV ecosystem.[19]
Challenges around supporting infrastructure in Indonesia prevail: as of November 2021, only 219 charging units were built across 185 locations.[20]
At the same time, given the strategic advantage around its nickel reserves, government incentives, and interest from private investors, the country is poised for strong growth in the EV sector. Toyota Indonesia, for instance, plans to construct a battery assembly plant starting in 2022, while LG has committed US $9.8 billion toward EV battery cell manufacturing,[21] allowing it to benefit greatly from the PIL incentives.
#14 VIETNAM
Strong automotive foundation spurring shift toward EVs
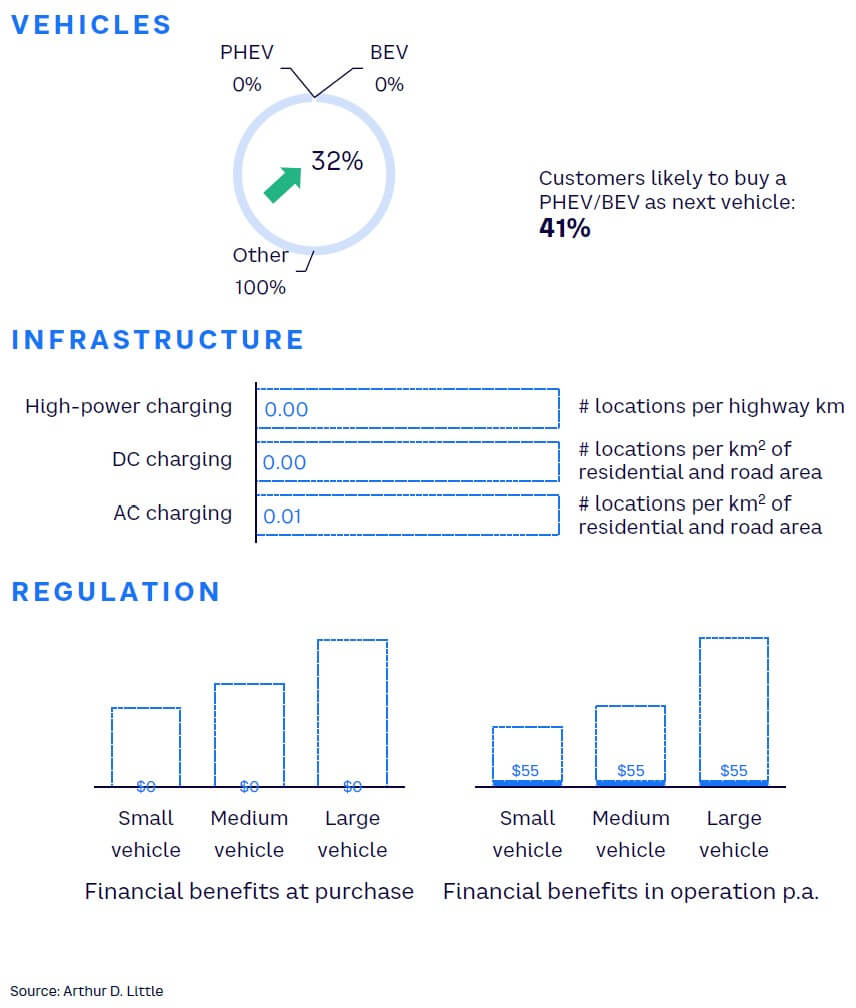
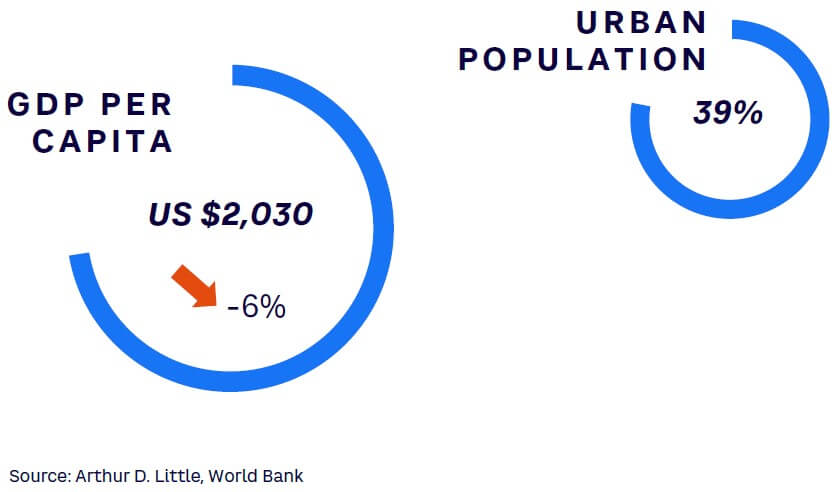
Along with environmental concerns, a key driver of Vietnam’s EV push is likely to be its massive Internet-savvy population. About a third of Vietnam’s consumers report they are likely to purchase an EV.[22] (See Figure 34 for a snapshot of the Vietnam population and Figure 35 for an overview of the EV market.) However, much remains to be done to leverage this potential. While Vietnam offers preferential tax programs for eco-friendly EVs, there are no lucrative government incentives for EVs.
Notably, Vietnam was the first country in Southeast Asia to host an EV manufacturing company. However, the EV sector has since grown sluggishly. Traditionally, Vietnam has not been very strong in manufacturing. For instance, engine components are designed and manufactured overseas and shipped to Vietnam. There is, however, growing interest among private players in the country, and VinFast, Kia, Mercedes-Benz, and Toyota are all placing bets on the Vietnam EV market.
Realizing the need to play an active role in EV expansion, the Vietnam government has exempted electric cars from registration fees for three years and reduced the excise tax on BEVs (of nine seats or fewer) to 3%, starting in March 2022.[23]
But to further enable electrification, the government’s focus must be on leveraging the interest of private players through policies centered around friendly taxes and ease of production, as in many other markets. Given that there are no concrete policy measures to boost manufacturing of EVs in Vietnam at present, apart from lower excise tax, the road to electrification remains challenging.
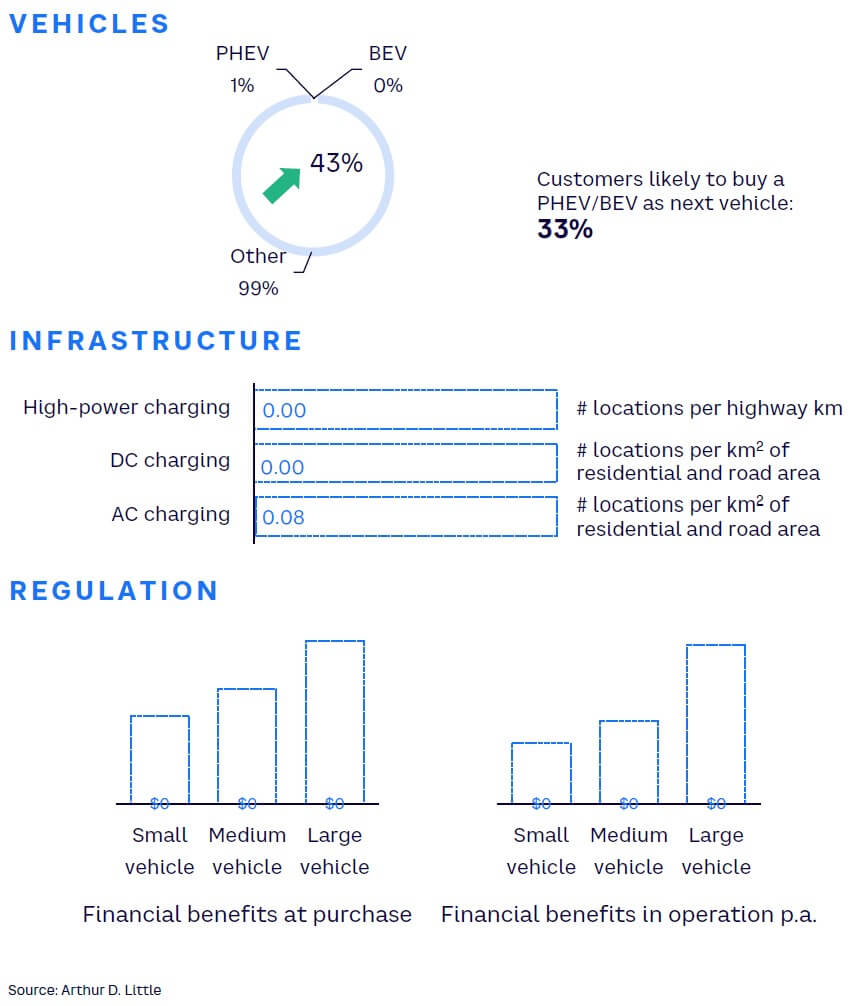
#15 SOUTH AFRICA
Nonexistent EV market likely to grow slowly in coming years
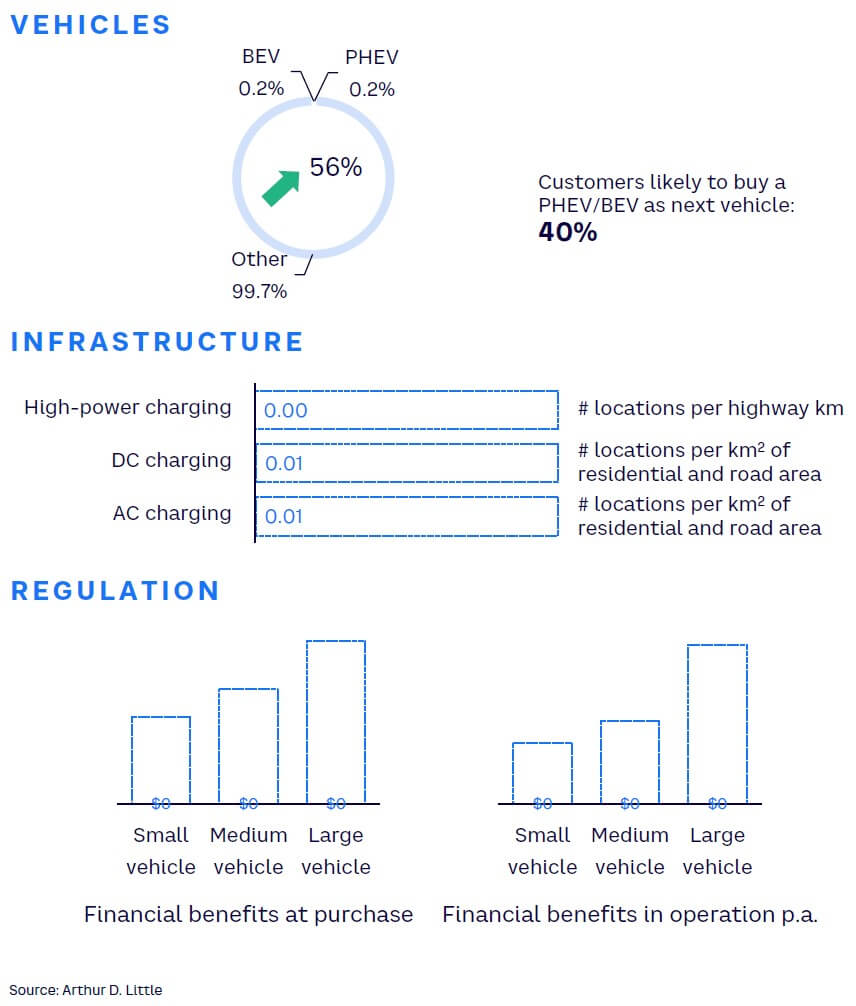
South Africa’s EV market is almost nonexistent, with fewer than 1,000 cars currently on the road. (See Figure 36 for a snapshot of the population of South Africa and Figure 37 for an overview of its EV market.) However, it is expected to grow in the next decade due to multiple government initiatives to reduce carbon emissions and combat global warming by catalyzing the EV sector.
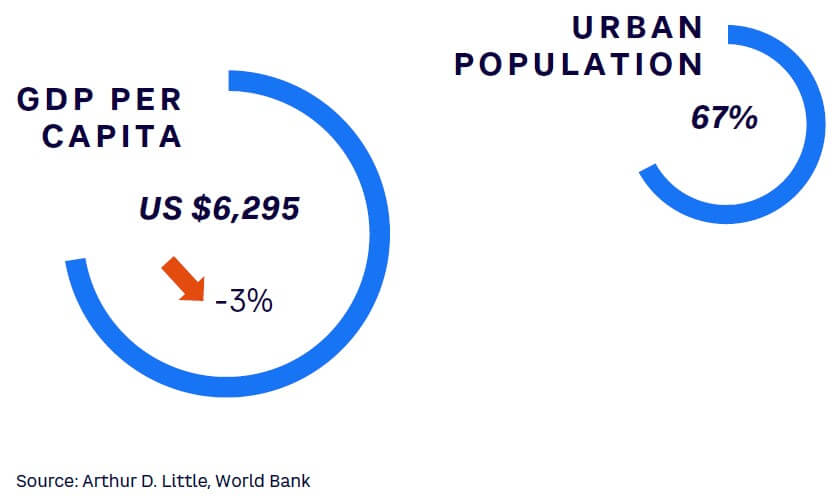
Such low EV penetration is largely due to the government’s limited focus, shrinking GDP per capita, and high up-front costs of EVs coupled with a poor electricity supply. The ongoing challenge to maintain constant power supply due to below-potential electricity generation makes consumers wary of purchasing BEVs.
However, there is an opportunity for increased sales of hybrid vehicles, as they can be powered by petrol or diesel when not using the electric motor. Further, import duties and taxes account for 45% of the cost of imported EVs, which is significantly higher than that for conventional fuel vehicles.
Currently, South Africa has 250-300 charging stations, with approximately one charging station for every four EVs in the country, giving it one of the highest station-to-EV ratios in the world. However, a lack of local purchase incentives combined with continued import duties will limit the uptake of EVs in the country and the potential for local production due to the lack of a market to offer EV producers some support.
To reduce the risk of electricity deficits, the government has amended Schedule 2 of the Electricity Regulation Act, lifting the license-exemption cap for generators to 100 MW. This is expected to bring in investments in the power sector and could benefit the demand for EVs as supply of electricity stabilizes.
In March 2021, the UK government selected 10 projects in South Africa to receive ZAR 64 million in funding to help decarbonize Johannesburg and Nelson Mandela Bay, which could boost development of the EV infrastructure in the country.
Companies like Audi, Mercedes, Nissan, and Opel are also launching full EV models in the country. This will attract investment in charging stations, which in turn will help attract the next tier of buyers.
Overall, the adoption of EV will be quite slow in South Africa as natural gas-powered vehicles could be the fastest, most cost-effective, and easiest route to reducing emissions of South Africa’s transport sector. However, there is growth potential for hydrogen fuel cell vehicles, as the country is more likely to adopt more affordable LNG-powered vehicles to cut emissions.
CONCLUSION
Policies, especially on subsidies and infrastructure, will spur EV adoption in all markets
Looking at all the countries we analyzed in GEMRIX 2022, it is clear that the trajectory of EV readiness is determined by the year in which efforts began, average income of the population, government incentives, and the orchestrated buildup of charging infrastructure. Every country can adopt EVs in the coming years, if the respective government wants to do so and invests accordingly.
In countries with higher incomes, subsidies are the primary tool to level the playing field between ICEs and EVs during the transition period, and customers are likely to choose EVs due to their environmental benefits. In those countries, availability of public fast-charging infrastructure will be the key determinant going forward.
In countries with lower average incomes and lower e-mobility readiness, subsidies are required to make e-mobility affordable by lowering TCO significantly below those of ICE vehicles in the short term.
This will spark interest and make up for current inconveniences in infrastructure. In the midterm, e-mobility followers can leapfrog EV development by quickly investing in the required fast-charging networks.
Technological development will continue to push EV costs below those of ICEs and drive customer decisions toward electric mobility.
Notes
[1] Banerji, Sumant. “The Hustle Is On: EVs Corner 46% of 3Ws; Over 2.5% of All Automobile Sales in India in FY22.” The Economic Times, 9 April 2022.
[2] Srivastava, Pradeep, et al. “Forecasting Penetration of Electric Two-Wheelers in India: A Bottom-Up Analysis.” TIFAC/NITIA, June 2022.
[3] Banerji, Sumant. “The Hustle Is On: EVs Corner 46% of 3Ws; Over 2.5% of All Automobile Sales in India in FY22.” The Economic Times, 9 April 2022.
[4] Howard, Bill. “Survey: 23% of Americans Would Consider EV as Next Car.” Forbes Wheels, 8 October 2021.
[5] Fischer, Justin. “Electric Vehicle Sales and Market Share.” YAA, 26 April 2022.
[6] Kane, Mark. “Norway: Plug-In Car Sales Maintain 85% Share in July 2021.” InsideEVs, 4 August 2021.
[7] Kvisle, Hans Håvard. “The Norwegian Charging Station Database for Electromobility (NOBIL).” World Electric Vehicle Journal, Vol. 5, 2012.
[8] Kawakami, Takashi, et al. “China Led World with 500,000 Electric Car Exports in 2021.” Nikkei Asia, 8 March 2022.
[9] “Net Electricity Generation in Germany in 2021.” Fraunhofer Institute for Solar Energy Systems ISE, 3 January 2022.
[10] “Statistical Review of World Energy.” BP, 2022.
[11] “How Many Smartphones Are in the World?” Bankmycell.com, accessed July 2022.
[12] “US Carmakers Aim for 40%-50% EV Sales by 2030.” Electrive.com, 5 August 2021.
[13] Shepardson, David. “US Automakers to Say They Aspire to Up to 50% of EV Sales by 200 — Sources.” Reuters, 4 August 2021.
[14] “Ford Targets 50 Percent EV Sales by 2030.” Ratchet + Wrench, 10 March 2022.
[15] “Time for the Middle East to Go Electric? How and Why?” Press release, Zawya, 14 April 2022.
[16] “Fewer People Buy Electric Cars in 2021.” Horsepower, 25 March 2021.
[17] Carney, John. “GM Announces $1 Billion Investment in Mexico to Build Electric Vehicles.” Breitbart, 30 April 2021.
[18] “Rising Fuel Prices Not Enough to Spark Brazil’s EV Market.” Automotive World, 2 February 2022.
[19] “Indonesian Electric Vehicles Industry Development Gains Momentum.” Indonesian AHK, 1 December 2021.
[20] “187 EV Charging Stations Are Fully Operated.” IDN Financials, 15 October 2021.
[21] “Indonesia and LG Group Sign $9.8 bln EV Battery MOU.” Reuters, 29 December 2020.
[22] “The Future of Electric Vehicles in South East Asia.” Vietnam+, 19 July 2022.
[23] Lang, Truong. “Can Vietnam ‘Pick Up the First Batch’ of the Wave of Electric Cars?” Viettonkin, 7 June 2022.
DOWNLOAD THE FULL REPORT
50 min read • Automotive
Global electric mobility readiness index — GEMRIX 2022
Examining the transformation to EV mobility

DATE

FOREWORD
Accelerated by the increasing threat of climate change, interest in electric mobility has escalated over the last four years, both within companies and across societies. At the same time, legislative and societal pressure on companies to counter climate change through new products, processes, and purpose has grown as well. The combination of these drivers have moved e-mobility topics up the strategic agenda for automotive executives around the globe.
Despite the mature globalization of the automotive industry, markets and their requirements differ significantly around the world. These differences must be well understood to successfully implement a “once in a century” disruption like the change from fossil liquid energy to electric energy — the change from molecules to electrons.
To assist executives in automotive organizations of all kinds around the world, Arthur D. Little (ADL) has set up a methodology to evaluate the “readiness” of markets for electric mobility. The standardized approach and detailed analysis of key market drivers for electric vehicles (EVs) enables a solid understanding of the current situation, and a standardized approach and evaluation metrics allow for comparisons across markets of overall readiness.
In this Report, we provide an overview of the key results of the 2022 edition of the “BEV Readiness Study,” which ADL first carried out in 2018.
— Dr. Andreas Schlosser, Partner, Global Lead, Automotive
EXECUTIVE SUMMARY & KEY FINDINGS
E-MOBILITY MARKET READINESS SPREADS WITH EVs GAINING GROUND
There has been a massive jump in EV adoption worldwide during the last two years. Norway has emerged as the leader, followed by three distinct groups of countries. All countries are moving to increase EV adoption, following similar patterns but with differences in time by a few years, as some started earlier than others. We discern differences between global markets primarily in specific legislation and to a lesser extent in socioeconomic factors. (In countries with higher income, for example, environment protection plays a crucial role, while in countries with lower average income, cost is the primary determining factor.)
Norway leads in EV adoption with a score of 115 in the 2022 ADL Global Electric Mobility Readiness Index (GEMRIX 2022). Next come the Ambitious Followers — China, Germany, UK, and Singapore — where all prerequisites for EV mobility are in place and EVs are on the verge of becoming mainstream. These countries are followed by the Emerging EV Markets: US, Japan, UAE, and Thailand. Here, EVs are still inferior to cars with an internal combustion engine (ICE), even though customers are becoming more comfortable with the idea of EVs as infrastructure is ramping up. Lastly, the Starters — Mexico, India, Brazil, Indonesia, Vietnam, and South Africa — have just entered the game and face major challenges in costs and infrastructure.
Among those benchmarked, Norway is the only country with an EV sales share of more than 50%. Among Ambitious Followers, EVs have a comparatively low share of approximately 15%-25%. Leading markets have a range of models, with six countries having more than 75, led by Norway and Germany. However, for globally acting OEMs, there is no one-size-fits-all solution. Manufacturers need to ensure supply while crafting individual sales strategies for countries, based on the readiness of each market.
Regarding Customer Readiness, cost is one of the most, if not the most, important drivers of EV adoption. This poses a challenge in developing countries as EV prices are still high and income is comparatively low. Thus, OEMs need to decrease costs while governments need to create incentives to pave the road to success and allow customers to enjoy electric mobility.
In terms of Infrastructure Readiness, battling range anxiety — the fear that a vehicle’s battery will not have sufficient charge to reach the destination — is a key issue. DC chargers are the right bet, as they lower charge time, are perfectly suited to highways, and decrease range anxiety. Charging industry players should focus on the Emerging EV Markets — as these countries are about to solve the chicken-egg problem (i.e., determining which must be in place first, infrastructure or EVs), if they haven’t already done so, and governments are pushing infrastructure buildup and players can win large-scale contracts.
Government Readiness hinges on a government’s willingness to take the first step by introducing wide incentives for purchasing vehicles. Customers should not pay a premium for EVs. Moreover, governments need to reduce the total cost of ownership (TCO) by introducing incentives for vehicle usage. Promoting EV adoption in Emerging EV Markets and Starter Markets will give charging infrastructure players the incentive to enter a country, creating a reinforcing spiral of EV adoption.
Betting on EV is no longer a risky gamble, and the predictability of the EV market is continuing to grow. The only major driver that cannot be fully predicted is government policy. However, making reasonable assumptions about this will give the industry in all countries firm ground on which to base their planning.
1
GLOBAL E-MOBILITY READINESS DISTRIBUTION
Markets worldwide are at three levels of readiness; only Norway has achieved “full readiness”
We are in the midst of a paradox of electric mobility: Norway, a country that became rich by drilling for and exporting fossil fuels, is the only market worldwide that is already fully EV ready. With a score of 115 on the GEMRIX 2022, EV is the clear choice in Norway. The index is designed to compare the market conditions for EV and ICE-driven vehicles. An EV readiness score of 100 means that in a given country it is equally beneficial to buy and operate an EV as one with an ICE. Higher values indicate advantages for EVs, while lower scores mean benefits for ICEs.
The rest of the benchmarked countries following Norway can be broadly categorized into three clusters as to their readiness (see Figure 1):
- China, Germany, UK, and Singapore are Ambitious Followers, with around 80 points. In these countries, switching to EV is no longer just an option for some enthusiastic pioneers; rather, it’s becoming a valid choice for the mass market. In the near future, all four countries have a concise political agenda to reach equality between EV and ICE. Driven by this agenda, the industry is gearing up in the respective countries. Consequently, consumers have seen a major jump in recent years in the number of available EVs and charge points.
- The Emerging EV Markets we see in the US, Japan, UAE, and Thailand have scores between 40 and 60. These markets still show significant drawbacks financially as well as in ease of operation for EV over ICE. However, all of them are investing heavily in electric mobility and will likely catch up soon. The US plays a special role in this group. As the home of EV pioneers like Tesla venture out to electrify the world, the US scored roughly 10 points over other countries in this group. The US is in a unique position, as the prerequisites for EV in East and West Coast states are very good, while in large parts of the country and much of the population, especially in the central states, ICE cars remain the emotionally and economically preferred option.
- Finally, we see a group of Starter countries, comprised of Mexico, India, Brazil, Indonesia, Vietnam, and South Africa. In these countries, electric mobility is beginning to enter the conversation; however, given their socioeconomic position, EVs are not a priority among politicians seeking election. In these countries, choice of vehicle is driven more by cost and utility considerations than by green aspects. Accordingly, we see an uptake in areas where TCO of EV starts to be equal or even better than ICE. Currently, this appears in the two- and three-wheeler space, which in those Starter Markets accounts for a significant share of the overall market. For example, in FY 2022, 46% of three-wheelers sold were already electric in India.[1]

Unsurprisingly, we see significant progress in EV readiness in all the benchmarked countries. However, reasons for this uptake (and for holdbacks) are very different per country. In the following chapters, we take a closer look into specific areas that are important for EV readiness and compare the different positions of the benchmarked countries. We follow up with deeper insights into each market to better understand the specific situations for manufacturers, customers, and other players along the value chain.
2
E-MOBILITY READINESS FACTORS
The overall EV readiness of a market is defined by four separate readiness factors
Studying global EV markets, we find that market readiness and EV adoption are driven by different factors in different regions. In some markets, environmental friendliness is key, while in others, ease of use (or the lack thereof) is the main factor in adoption. Many countries, especially those in the Starter group, primarily focus on cost, which has different aspects.
To summarize, the following four main factors of readiness drive EV adoption: (1) market, (2) customer, (3) infrastructure, and (4) government. We used these readiness factors as a framework for our analysis.
1. MARKET READINESS
Industry players in each country contribute significantly to the attractiveness of EVs to customers. The number of vehicles offered and how they are brought to market can spark the interest of consumers or can prevent them from even thinking about EV if the offer is not attractive. This involves a combination of factors, including the number of products offered and the segments covered by them, product quality, design and concept creativity, as well as pricing.
2. CUSTOMER READINESS
How ready a customer is to buy an electric vehicle does not hinge only on objective factors like the availability of home charging points. It is also a very subjective matter, influenced by the general perception of EVs and personal preferences. For this study, we looked at the hard facts and the predominant socioeconomic conditions in each country to assess customer readiness.
3. INFRASTRUCTURE READINESS
Infrastructure readiness primarily comes down to the availability and performance of charging options (i.e., the number, distribution, and quality of public charge points). Even in the benchmark market, Norway, most EV charging still occurs through private options today. However, a dense public infrastructure lowers psychological barriers for customers and increases EV usability. It is also a precondition to reach customer segments without private parking and charging opportunities (whose demand for EV will reduce the share of home charging in the future). To evaluate infrastructure readiness, we also investigated charging power (AC, DC, and high-power charging) in addition to the pure number of facilities available. Finally, we took geographical distribution into account. In the end, even the best inner-city charging network does not help when traveling long distances.
4. GOVERNMENT READINESS
Legislative and regulatory bodies play a central role in shaping the market for EVs. The entire ecosystem around ICE vehicles has evolved and was optimized for more than a century, supported by unimaginable investments and subsidies. Without specific incentives and legislative interventions, it is next to impossible to overcome this head start in the time required for climate protection. Different governments found different approaches to incentivize EVs and/or disincentivize ICE vehicles, which we analyzed in terms of their implementation and effectiveness.
Together, these four factors provide an overview of EV readiness in each country, not only in arriving at their overall readiness score but also in gaining insights into the measures needed to increase EV readiness. We discuss the latter later in this Report in the chapter “The Next Steps.”
3
MARKET READINESS
Competition in EV skyrocketed last two years, providing customers with progressively better options
The dynamics of EV markets globally have proved to be very volatile. While just two years ago the EV market outside China was dominated by emerging players (with Tesla leading the way), many incumbent OEMs have since raced to overtake them (see Figure 2).

German OEMs are a good example of this volatility. Up to 2019, they only reluctantly introduced EVs. Customers interested in electric cars of a new kind largely had to turn to Tesla. Starting in 2020, however, pushed by government initiatives and the pressure of coming late to this important future market, German OEMs rapidly introduced new all-electric lines and models. Mercedes-Benz introduced its EQ line and Volkswagen the ID, Audi expanded its e-tron brand, while BMW i experienced a rebirth with more models next to the i3. With all domestic OEMs offering EVs, Germany jumped to the second position behind Norway in the number of available EV models, with 158. Markets such as the UK and the US saw a very similar uptake, as major US OEMs — including Ford and GM — also electrified their mainstream model lines.
Plug-in hybrid electric vehicles (PHEVs) have played an important role in EV adoption in early market phases (e.g., Norway, the Netherlands, and Germany). However, commonly, it is a shift in customer demand and vehicle supply toward purely battery electric vehicles (BEVs) that mark a maturing EV market. Effectively, a falling number of PHEV models with an overall growing preference for EVs is a strong sign of a more mature EV market. We foresee this as a development for Starter countries as well. Brazil, Indonesia, Vietnam, and South Africa, for example, have a very high share of PHEVs today, which will decline over time.
However, we see a much different story in the developing markets: Thailand, Mexico, India, Brazil, Indonesia, Vietnam, and South Africa. India illustrates the dynamics in these markets: with 40 different types of vehicles on offer, customers enjoy a good variety. Nevertheless, this is mainly in the two- and three-wheeler space. While private cars in India do not yet have a significant share of the EV market, scooters and commercial three-wheelers for logistics and transport services have a massive uptake. Significant competition has developed, driving prices down and quality up. Production of electric scooters and three-wheelers has reached large-scale efforts; electric two- and three-wheeler sales grew at 460%[2] and 102%,[3] respectively, in FY 2022. The cost advantage of waiving ICEs led to very competitive sales prices. Combined with the recent increase in oil prices, the total cost of operating electric two- and three-wheelers is much lower than that of other vehicles, which is the most important factor in these countries.
4
CUSTOMER READINESS
Price vs. purchasing power and access to charging infrastructure are global drivers of customer readiness
Broadly speaking, the readiness of customers to buy an EV is determined by their willingness and ability to do so. Ability comes down to accessibility and price. Even though the prices of EVs have fallen, investing in a vehicle in many countries remains a major undertaking — even more so in the case of an EV (see Figure 3). In Thailand, for example, the average yearly income is US $5,716. This market offers a variety of ICE cars in the price range of US $9,000-$12,000, a cost barely affordable for many. The cheapest EV car in Thailand starts at just below US $30,000. At that price, electric four-wheelers are not accessible by the general public. In two-wheelers, however, prices are much more attractive. An ICE scooter starts at approximately US $900 and an electric scooter is available at almost the same price. Additionally, the scooter can be charged using a standard household plug, while a car would require the installation of a wall box or a public charging pole, an additional hurdle for the average customer in Thailand.

The topic of charging naturally leads to accessibility. In ADL’s study, we see a correlation between the share of population living in urban areas and EV readiness. Lack of access to public charging infrastructure is a massive hurdle to the adoption of EV. Globally, the density of public charging points in rural areas is nowhere near the density of petrol stations. With most EVs still of lower range as compared to their ICE counterparts, countries with a large rural population have a significant challenge to solve, as is very visible in India and Vietnam. Again, this hurdle is much less pronounced for two-wheelers, which can effectively be charged using standard household power lines.
Concerns about environmental protection play the second most important role in readiness to buy an EV. We see a clear correlation between EV readiness and environmental awareness, as measured primarily by the number of governmental activities and the number of years since those activities were introduced. While this aspect is very important in Norway and Germany, in a country like India it only reaches a very small group of customers. Furthermore the “coolness” of driving an electric car is a determining factor — again, primarily in Europe and North America.
In summary, GDP and income levels indicate if a market is driven primarily by cost or if societal trends like environmental protection play a role.
5
INFRASTRUCTURE READINESS
Government support is necessary to kickstart development of public charging infrastructure
Before market solutions and entrepreneurial players for charging infrastructure can arise, governments need to invest to support development (see Figure 4). The experience from leading markets like Norway and China shows how governmental programs powered — and are still powering — the expansion of charging infrastructure. Before companies became active and EVs rolled over streets in high numbers, the Norwegian government implemented a €7 million program for kick-starting its charging infrastructure rollout, resulting in nearly 2,000 charge points by 2011. Additionally, Norway supported funding for housing associations to install private charge points early. China follows a similar approach — the more than 1 million chargers it boasts today were mainly built and operated by the government or through state organizations and companies.

Charging infrastructure is critical for customer adoption of EVs. In the US, 30% of respondents to a Forbes poll said there are too few charging stations available, hinting at the problem of range anxiety.[4] In the US, only around 6,000 fast charging stations are installed so far (1,400 of them exclusive to Tesla) compared to the roughly 260,000 km of highway network. This could be why battery electric vehicle (BEV) sales share in the US was at less than 4% in 2021.[5] However, the current US administration has implemented a US $5 billion program to install 500,000 more charge points over the next five years.
FAST CHARGING REQUIRED
While in embryonic EV markets the availability of private charging at home or at workplaces is the key enabler, every significant step-up in a market’s EV adoption requires public charging infrastructure. Only a dense-enough and easy-to-use public charging infrastructure enables long-distance travel by EV and opens the market to those customers without access to private overnight parking with electric power supply.
Because the lack of public charging is the greatest hurdle in starting EV markets, and the costs of infrastructure setup and charging play a major role, AC charging up to 22 kW was the first choice in early EV markets. While these charging speeds are sufficient for small battery packs and charging use cases that allow for several hours of charging, they fail in en route charging and locations with high and continuous charging demand.
We observed that DC charging becomes the preferred choice in a growing number of public charging use cases, including destination, curbside, and en route highway charging, where maximum outputs can reach up to 300 kW currently. Only DC charging powers of around 100 kW and above enable a quick refill for driving distances greater than 50 km in an hour or less.
Norway, Singapore, the UAE, and Japan score high in the index for their public DC charging infrastructures, while the UK, Germany, and the group of Starter markets are AC-heavy beyond the main highway connections. Changing existing infrastructure to DC or creating a sufficient density of DC charge points will require significant investments in those markets over the next years. Starter markets preparing for the first wave of EVs can leapfrog to DC charging in public spaces.
6
GOVERNMENT READINESS
Subsidies directly impact EV readiness of a country
As seen in the customer readiness analysis above, price is the most important factor for customer decisions between ICE and EV. ICE vehicles have had a head start of more than a century in optimizing production at scale and in building an ecosystem, allowing customers to buy and operate vehicles affordably and conveniently. Therefore, legislators have introduced various EV incentives to compensate for economic disadvantages, which can be clustered into three broad categories:
- Sales price incentives (tax reduction or lump sum).
- Ownership incentives (mostly reduction of motor vehicle tax).
- Operations incentives (lower energy prices, reduced tolls, reduced parking prices/exclusive parking).
Our analysis shows that these incentives work in many countries. Especially when looking at the combined amount of subsidies from all three categories, shown in Figure 5, we see that the countries that have had higher subsidies for a longer time generally score higher in our overall ranking. Sales incentives are clearly capable of moving the entire EV industry forward.

The prime example again is Norway. By waiving the value-added tax (VAT) on EVs, which is 25% in Norway, the end customer price for a new US $50,000 vehicle effectively falls to US $40,000 for a private customer. As a business, one could deduct the VAT anyway. Thus, EV adoption in Norway has been driven primarily by private customers, which has pushed the market forward and has allowed the overall network effects to generate advantages for commercial customers as well.
When it comes to commercial purchases, Singapore provides a flat rebate on EVs of up to US $15,000 depending on the model. Additionally, Singapore decreased tolls for EVs, making them not only more cost-efficient to buy but also to operate. Moreover, in some states of Mexico, EV owners are exempt from the “Tenencia,” an annual vehicle tax based on car value, amounting to savings of approximately US $850. Additionally, in leading EV countries, the costs of driving 100 km on fuel is nowadays comparatively higher than those of doing so on electricity, also due to taxes.
END OF FOSSIL FUEL ENGINES IN AUTOMOBILES
The roadmap is already defined: Norway will be the first country to ban the registration of new ICE passenger cars from 2025 onward (see Figure 6). In 2030, more markets we studied will follow, phasing out sales of traditional ICE vehicles (e.g., Singapore, UK). The last major global automotive markets like China, Germany, and Japan will follow in the 2030s.

Meanwhile, regulators (e.g., in Europe) have also raised the technical standards for ICEs regarding emissions and fuel consumption. EURO VII emissions standards, for example, will bring the additional development and manufacturing costs for traditional powertrain components to levels that surpass those of electric powertrains.
Because ICE production volumes will decrease and electric powertrains will continue to become cheaper and cheaper, ICEs will be dead economically long before countries like France, Spain, or Portugal officially prohibit their sales in 2040. This will not even require global regulation: the tipping point is as close as one typical ICE generation lifecycle before the ban occurs in the big technologically leading markets like Europe, Japan, China, and the US. Thus, we expect the current decade to be the last in which we see significant amounts of new passenger ICEs being developed.
7
THE NEXT STEPS
What markets must do to become front-runners in e-mobility readiness
The die is cast for battery electric powertrains to be the main technology of the next 20-30 years in passenger engine vehicles, thanks to political agendas and the urgent need to flip transport markets from fossil fuels to carbon-free alternatives. However, both suppliers and customers will have a difficult time through the transition.
Norway, the front-runner in e-mobility, shows how long it may take to turn even a small market and vehicle fleet toward EV. Norway’s journey began in 2011, when EVs were rare and exotic, and the first Teslas were not yet in series production. Ambitious Followers and Starter EV markets of today will have it easier, as market conditions like model availability, TCO, and environmental awareness have improved on a global scale over the last 10 years.
Financial incentives for EVs or disincentives for ICEs may still be adequate support measures in a starting market. But in maturing EV markets globally, the true winning factors have changed: EVs, like ICEs, require a functioning ecosystem that must be holistically set up by multiple parties, as described below.
INFRASTRUCTURE
Formerly independent industries, such as vehicle OEMs, energy companies, road infrastructure and service providers, and telecom and software companies, need to work together with local and national authorities to provide widely available, easy-to-use, and reliable charging infrastructure for EVs. Only an integrated approach can ensure cost-effective and customer-oriented infrastructure development without jeopardizing grid stability and macroeconomic feasibility.
CLOSED-LOOP EV SUPPLY CHAIN
Successful EV markets will require a resilient, sustainable, and effective EV supply chain either domestically or in close reach. This involves the availability of raw materials, key components, and focal capabilities for EV. It will also necessitate a circular approach — reducing and reusing natural resources — to make e-mobility a truly sustainable alternative and to ensure supply of scarce inputs. Examples for this approach can be found in China, with hundreds of players in the EV area, but also Central and Northern European markets, which have discovered the attraction of domestic battery production and recycling. Southeast Asia, with automotive hubs in Thailand, Malaysia, Vietnam, and others, is already setting up to follow this EV cluster strategy.
MULTI-STAKEHOLDER ORCHESTRATION
Governments and regulators have played a central role in supporting e-mobility and will continue to do so. But they need to change their approach for the next act. EV infrastructure and supply chains are key prerequisites for successful e-mobility markets of the future. Both require holistic and integrated action from disconnected parties and market actors. This “garage band” needs a conductor to become a symphonic orchestra, and markets need more than tax incentives on one hand and restrictions on the other.
Corporate players, too, can assume the role of integrators. Markets in which either entrepreneurs or authorities successfully assume integrative roles in the areas of infrastructure and supply chains will become Ambitious Followers quickly, or even future leaders.
MARKET READINESS DIFFERENCES ATTRACT DIFFERENT PLAYERS
Leaders & Ambitious Followers
Mature EV markets like Norway, Germany, and China are at a stage that enables the entry of all kinds of EV actors, holding potential for established EV OEMs and scaled-up providers of charging infrastructure and ecosystem services. Customers in these markets appreciate a growing and still improving offering and have a rather high willingness and ability to pay — but also have high expectations. These markets are in rapid consolidation and market entry barriers for new entrants are high.
Emerging EV Markets
Players that still want to shape an EV market with new and selective vehicle offerings and charging infrastructure solutions will turn to Emerging EV Markets like the UAE or Thailand. These markets are not yet fully divided up among incumbents and are growing rather quickly — a very promising environment to scale up and to create a home base for later expansion or to enter for increased market share and dynamically growing revenues.
Starter Markets
Slightly late to the party, Starter Markets offer potential for new startup style entrants and for early infrastructure development in a “blue ocean environment,” where market shares are not yet divided up, but profit pools are limited and need to be developed first. These markets require patience and willingness to invest. Established players would rather wait for others to prepare the ground and make a late market entry with scale and financial power.
HOW ACTORS CAN COPE
Vehicle manufacturers
Manufacturers can adapt their offerings and supply chain planning to market readiness levels (e.g., in quantitative sales planning and product management).
In markets with higher index scores, such as Ambitious Followers, EV sales planning can follow proven methods, considering target segments, pricing, positioning, and product specifications. In addition, sales planners should note that powertrain disruption usually decreases brand loyalty. A convincing EV model offering helps to conquer market share and tap into new market segments, as demonstrated with examples such as Porsche Taycan and Hyundai Ioniq 5.
Starter Markets and markets with lower readiness, however, need special methods of sales planning and market entry. OEMs frequently prefer selective offerings, first targeting the most promising customer segments with lower risk. Sales planning must adjust to the fact that a new offering is only part of market preparation. It may, nevertheless, be more successful than expected due to the lower level of competition. As a brand, gaining market share with new EVs is even easier in a starting market than in more mature environments — at lower absolute levels.
Infrastructure providers
Norway and Ambitious Follower markets are experiencing consolidation of the charging infrastructure market. Players that have not yet pegged their positions — and established partnerships, customer bases, and solid market shares — should look for different environments. For incumbents, this is the phase for scaling and setting up fast public DC charging at attractive locations. Increasing utilization of charge points will be key. Public mega-watt charging for trucks and commercial vehicles will be the next big topic in more mature EV markets.
Infrastructure players in Starter Markets should avoid copy-and-paste strategies from early EV markets like Norway and not rely on the rollout of wide AC networks in the public space. Today, battery packs are bigger, BEV shares higher, and customers in many developing markets require public charging as they lack private parking and charging possibilities. Leapfrogging to quicker DC charging solutions at destinations and charging parks in fuel station locations may be strategy to avoid the need for additional investments in five years.
We expect today’s Starter Markets to develop EV readiness quicker than first benchmark markets and thus charging needs to catch up sooner rather than later.
GEMRIX 2022 METHODOLOGY
ADL’s Global Electric Mobility Readiness Index has been calculated for 15 countries in the current edition to make it easy to compare market data and metrices across different areas (see Figure 7). The index has been calibrated around a notional threshold value of 100. A score of 100 implies that the market readiness for e-mobility is on par with ICEs across relevant buying criteria, such as costs, utility, and availability. Thus, a score beyond 100 shows that EVs are even more beneficial than ICEs.

Market readiness is evaluated in five major categories that drive EV adoption: macro-economic market factors, EV market and competitive landscape, customer EV readiness, public charging infrastructure, and TCO and regulation. Each category consists of six to 15 specific data points that were analyzed with a standardized metric for each country, rendering a total of 45 variables per country.
The five categories were weighted according to their relevance for EV adoption. Markets can score a different number of points in each category, with each category varying by weight and depending on market data. The individual point score is calculated from analytics that consider relative and absolute performance measures. The final index score is the sum of performance indicators from the five subcategories, allowing for a detailed evaluation of a market’s e-mobility readiness.
#1 NORWAY
Leading in EVs and sustainability
Norway is leading the EV movement across the globe. More than 85% of new vehicle sales in that country have been PHEVs.[6] This adds to a long history of leadership in many sustainability areas. For example, the country’s utilities sector is mainly built on renewable energy from hydropower, with 45% of its energy mix coming from hydropower; the first hydropower plant was built in 1892. Moreover, 98% of electricity production already came from renewables in 2016.
One driver for Norway’s EV adoption certainly is its high share of urban population. Of Norway’s inhabitants, 84% live in cities (see Figure 8). As a result, the usual range anxiety, a major inhibitor of EV adoption, is less relevant, since city driving covers fewer kilometers.

However, as Norway is a vast country, average trip length is high, at close to 15 km per day, on average. The government countered possible range anxiety by launching programs to install charging infrastructure as early as the late 2000s, resulting in investments of about 2,500 charge points by 2011 (see Figure 9).[7]
As Norway has historically not had a large car industry, automotive suppliers are currently flocking to the Nordic country. For example, battery cell manufacturers Freyr AS and Morrow Batteries have set up shop in Norway, and battery recyclers Swedish Northvolt and Canadian Li-Cycle are building plants in the country. The high availability of renewable energy for electricity-intense operations is the key driver of this development.
Norway’s government resolved the previously mentioned economic chicken-egg problem through government-funded infrastructure projects as well as tax breaks for EVs. As stated earlier in this Report, the 2,000 charge points were built through a program costing just €7 million. Furthermore, Norway committed to establishing chargers at intervals of at least every 50 km at major roadways, and successfully fulfilled that goal. To further accelerate EV adoption, Norway suspended import taxes on EVs in 1990, decreased annual registration taxes in 2000, and slashed EV VAT to 0% in 2011.
Its focus on cutting taxes paid off as EVs became the major technology in 2019 to reach a 50% share of sales, and pure BEVs reached 50% of sales in 2020.
Also, Norway has set ambitious goals for the future, declaring a target of zero local emissions from passenger vehicles by 2025. Putting this in perspective, the EU aims for a decarbonized mobility sector only by 2050. Moreover, Norway has set targets for 2025 that other nations have set only for 2030 (e.g., UK) or 2035 (e.g., Germany).

#2 CHINA
Strong local BEV ecosystem creating challenges for international OEMs
The EV industry in China is the largest in the world, accounting for about 57% of global production of EVs and export of around 500,000 EVs in 2021.[8] Plug-in electric vehicle (BEV/PHEV) sales amounted to nearly 15% of overall automotive sales in China in 2021, and these sales were driven mostly by local automotive companies. With China representing about 50% of the global BEV market, international OEMs must increase their value to customers and find cost-saving opportunities by designing vehicles to meet local requirements.
While global players are strengthening their technology position, they also need local ties to realize additional opportunities. Chinese OEMs like Xpeng, NIO, Geely, and BYD all saw record growth in EV sales in 2021. These regional companies are providing a superior customer experience to local consumers (see Figure 10 for a snapshot of China’s consumer population). Features such as strong human-machine interfaces and connectivity differentiate them from the competition.

With over 2.2 million charging stations throughout the country, China’s EV infrastructure continues to expand at an impressive rate (see Figure 11). With the successful transition to EVs so far, China’s charging network has grown in step with other technologies such as battery swap stations. As a result, it has established itself as the current leader in EV infrastructure.
Since 2019, China started a mammoth plan to add 600,000 charging stations. This robust foundation of EV infrastructure is playing a major role in the growth of EV sales at a CAGR of 18% over the coming years.
The Chinese government is supporting the development of the EV industry through regulation. There are encouraging policies and measures for both EV manufacturers and purchasers as well as incentives for business operators to engage in and improve charging and other peripheral services. Financial benefits for customers can range from around US $1,500-$2,000 per vehicle and about US $1,000-$1,500 for manufacturers.

#3 GERMANY
Strong automotive foundation thriving toward EV
Germany has always been a strong automotive market, hosting many of the world’s most renowned brands, especially in the high-end sector. Comparing the number of cars on German roads to the population, statistically more than every second person owns a car in the country (see Figure 12).

Additionally, environmental protection has long played a significant role in Germany. The first legislation on the “Energiewende” (energy transition) dates to the late 1970s. Today, approximately 46% of electric energy is generated from renewable sources.[9] The current political uncertainties around energy import from Russia have prompted Germany to increase the local production of renewable energy even further.
The automotive industry in Germany, however, maintained a strong focus on ICEs for a long time. While the hype around EV from 2010 to 2013 was already high in countries like the US and China, German manufacturers only started serious production of EV passenger vehicles around 2019–2020. Despite the late start, German OEMs picked up the pace, and today, more than 70 different BEVs are on the market, representing a healthy mix of local and international brands (see Figure 13).
One of the major barriers to adopting EVs in Germany is the aforementioned chicken-egg challenge of consumer unwillingness to buy vehicles due to poor charging infrastructure and industry unwillingness to invest in infrastructure due to poor vehicle sales. Germany recently made a new attempt to break this vicious cycle with many new, attractive EVs coming to market spanning all price ranges. Many of these vehicles come with a free (or at least well-priced) wall charger, making EVs an attractive offer for the considerable portion of the population living in single-family homes with a parking spot.
Combined with the substantial financial benefits offered by the federal government, EV adoption increased significantly. This in turn made investment in public charging infrastructure attractive for players from the automotive, oil, and energy industries, as well as startups. Notably, German manufacturers’ sudden increase of vehicle models was also driven by the fact that other global OEMs threatened to take over this new market entirely.
Certainly, the newfound German appreciation for EVs also benefits from EU regulation like the announcement of banning registration of new ICE vehicles by 2035.

#4 SINGAPORE
EV sales boom in Singapore with new governmental measures
Singapore suffered a setback to increasing EV penetration during the pandemic but has bounced back sharply with new measures to promote EV sales.
With a strong economy (an estimated per capita GDP of US $59,500) and almost 100% urbanization (see Figure 14), Singapore consumers are not anxious about driving range and are willing to pay a premium price for EVs, considering the manifold advantages. The government has also been clear about its encouragement of EV adoption through its announcement in March 2021 that all new car and taxi registrations will need to be clean energy models from 2030 onward, and that all vehicles on roads will need to run on clean energy by 2040.

EV sales are expected to continue to grow at an average annual rate of 40% year-on-year — to reach an annual sales volume of just under 7,000 units by 2030 and an EV-penetration rate of around 9.6% of total vehicle sales in the same year. (See Figure 15 for an overview of the EV market in Singapore.)
The Singapore government announced in its 2021 budget speech that US $25 million has been set aside over the next five years for EV-related initiatives entailing public-private partnerships. This could include measures to improve charging availability at private premises. Singapore will also accelerate the development of its charging infrastructure to better support the growth of EVs in the next decade, aiming to enable the rapid growth of EV sales at around 40% year-on-year. The plan is to deploy 60,000 charging points at public car parks and private premises by 2030 — more ambitious than the previous target of 28,000 chargers.
Financial regulations in Singapore are quite progressive as well. New policies such as the Vehicular Emissions Scheme, together with the EV Early Adoption Incentive initiatives, provide tax rebates to reduce the prices of some electric cars by up to US $15,000.
All these measures are motivating consumers and fleet operators to shift from ICEs to EVs as the transition becomes increasingly user-friendly and have put Singapore at the forefront of EV adoption across the globe and second only to China in Asia.

#5 UK
Fast acceleration with a promising future
Electric mobility is slowly becoming a success story in the UK. In 2021, nearly one out of five vehicles sold were electric. The dominating technology is fully BEVs, as 12% of total vehicles sold used a purely electric drivetrain (see Figure 16). Since the COVID-19 pandemic, EV sales shares have skyrocketed and grew over the last two years at more than 56% per annum.

The UK government has set ambitious goals for building up its charging infrastructure. In 2021, the public and semipublic charging infrastructure stood at around 39,000 charge points, of which only 1,200 were less than 150 kW DC fast chargers. The country aims for at least six rapid charge points at every motorway service area by 2023.
By 2030, more than 2,500 high-power charge points are scheduled to be added across strategic road networks. In addition to its large public infrastructure program, the UK also subsidizes private home charging with a grant of up to £350.
One obstacle in the future might be renewable energy supply. With a renewable energy generation per capita of 1,782 TWh, the UK ranks last among developed countries (excluding Singapore). Moreover, only 17% of its energy consumption stems from renewables.[10] As the use of renewable energy sources is critical to EV sustainability, we see this as a development opportunity.
Governments and cities are endorsing EV uptake through bans and regulations on the one hand and incentives to empower end consumers on the other. By 2030, the UK aims to ban all new registrations of ICE vehicles. Furthermore, parts of cities are regulated through congestion zones in which vehicle operators must pay if emissions and traffic density standards are not met. For example, in London’s Ultra Low Emission Zone, petrol cars and vans must meet at least Euro 4 standards to avoid charges, whereas in Oxford’s Zero Emission Zone, every vehicle with local emissions is charged — even PHEVs. Additionally, EV purchase subsidies are in place for up to £1,500, as well as exemptions from road tax and an expensive-car supplementary tax. Further, the UK government also drives corporate promotion of EVs with a capital allowance and a benefit-in-kind tax. In total, we estimate that a battery electric company car has an advantage of more than £8,500 spread over three years over a similar ICE car.
In recent years, the UK has started to embrace the change from ICEs to EVs and is accelerating fast to nudge end customers in the direction of the electric powertrain. The steep increase in EV sales and the rapid buildup of infrastructure indicate its success. Furthermore, with Britishvolt entering the battery cell production business, the British economy is also likely to benefit from a more domestic EV supply chain.

#6 US
Robust government measures creating sustainable EV ecosystem
Until now, EV adoption has been slow in the US, where EVs have around a 4% sales share and only around 2.5% of vehicles are fully battery electric. Currently, only about 1% of the more than 280 million passenger vehicles in the country are electrified. As the US has always been a country of significance for the whole automotive industry, the developments will be exciting to monitor over the next years.
The US has favorable macro factors that are setting a promising framework for EVs: high GDP per capita at close to US $70,000 and 3% GDP growth over the last three years indicate adequate disposable income in many cases (see Figure 18). One of the highest motorization rates across the globe, with nearly 850 cars per 1,000 inhabitants, establishes the potential of the market.

High smartphone penetration of 82% and the third place in innovation index rankings also shows the US’s affinity for innovative technologies.[11]
However, a lack of infrastructure is a major inhibitor for now: charge point density on highways is very low, at approximately one or two charge points per 1,000 km (see Figure 19). The East and West Coasts boast better infrastructure than the Central and Midwestern states. Additionally, energy infrastructure might pose a problem for home charging, as residential homes are usually served by a single-phase power supply; only commercial sites have the three-phase power required for 22 kW chargers. This creates one of the largest challenges in the US, as range anxiety is the second biggest inhibitor with more than 25 km traveled per trip per inhabitant.
The rise of Tesla arguably kicked off the electric mobility movement across the globe and revived the US automotive industry. Tesla’s Model Y and Model 3 are the most popular EVs within the US. GM and Ford followed up on Tesla’s success by announcing ambitious EV sales plans. GM aims for 40% of global sales being electric by 2025[12] and 100% of passenger EVs by 2035 in the US.[13] Ford targets a 50% share of EV sales by 2030.[14] This led to more than 100 plug-in models available for purchase in the US in 2021. New market entrants are also flocking to the market, such as SUV brand Rivian and Lucid Motors. The automotive industries’ development is favorable, but thus far EV car sales have been driven mainly by pioneer customers and state regulation.
Low fossil fuel prices and a lack of charging infrastructure have so far counteracted wider EV adoption.
Encouragingly, the current US government has announced more ambitious plans. In 2021, it declared the goal of 50% of sales being of EVs by 2030, with the addition of 500,000 new charge points. It backs up these claims by subsidizing EV purchases with tax credits of up to US $7,500 and a fund for infrastructure rollout, including US $5 billion for the installation of chargers. These developments make the US one of the most attractive countries for EV players in the next years.

#7 JAPAN
A potential not yet exhausted
EV sales as a percentage of total auto sales for Japan were below 1% for 2021, with an estimated annual sales volume of about 42,000 units. However, while EV adoption has been low, recent initiatives taken by the government and OEMs are expected to bring a much-needed boost to electrification. (See Figure 20 for a snapshot of the population of Japan and Figure 21 for an overview of its EV market.)

In 2021, the Government of Japan set a target for all new cars sold by 2035 to be environment friendly, which will push EV sales. The government has also subsidized part of the cost of purchasing EVs, particularly BEVs, PHEVs, and fuel cell EVs (FCEVs). Local automakers such as Toyota, Suzuki, and Honda have plans to expand their EV offerings in 2022, increasing supply in the market.
While PHEVs and BEVs have not seen high adoption in the country, hybrid EVs (HEVs) are quite popular, with more than a 30% share of total auto sales. Japan also has a strong EV charging infrastructure, with about 30,000 charging stations, and the government plans to increase the number to 150,000 by 2030. With a strong mix of urban population and regulatory push, Japan is slated to become one of the bigger EV markets globally.
Japan’s laggard approach to e-mobility is largely due to its huge investments in gasoline-electric hybrids. Nissan Leaf is the only successful BEV currently operating in the country. Thus, both the government and Japanese companies have good reason to hold their bets on EVs.
Today, Japan dominates the global market for the current generation of gasoline-electric vehicles. Given customers’ familiarity with this technology, their preference to shift to PHEV/BEV is far lower than that in other developed nations. More than 30% of all vehicles sold in Japan are HEVs. After incentives provided by the Japanese government in 2012, electric charging infrastructure developed rapidly in the country, with more than 30,000 stations already operating. As demand for HEVs continues to rise, the EV charging infrastructure will further improve. The government provides subsidies at the point of purchase for EVs but no such incentive is currently provided for operating such a vehicle.
As the EV space continues to evolve, Japan will surely move to avoid being left behind.

#8 UAE
Strong infrastructure push by government will push EV adoption
The UAE EV market is currently in the early stages and forecasted to grow at a CAGR of 30% between 2022 and 2028. Passenger vehicles constitute around 95% of the EV market in the UAE due to an increase in rental car services and the limited scope for commercial vehicles in transport and logistics. (See Figure 22 for a snapshot of the UAE population and Figure 23 for an overview of the EV market.)

Under UAE Vision 2021, the government has promoted EV adoption across the nation. It has converted 20% of government agency cars to EVs and further intends to reach 42,000 EVs on the streets by 2030. The UAE today has one of the biggest charging-station-to-vehicle-ratios in the world. Dubai’s EV Green Charger initiative was launched in 2015 to increase the number of charging stations. Since then, the network has expanded and, as of this writing, the country has 325 charging stations.
To promote the use of EVs, Dubai Electricity & Water Authority and Road Transport Authority are working jointly on incentives like free parking, exemption from toll, and reduced registration fees. They aim to make public transport emission-free by 2050.
The region’s first EV and battery logistics hub has been opened in Dubai’s Jebel Ali Free Zone, in line with the UAE’s transition to a circular economy by ensuring a reliable supply chain for sustainable mobility solutions.
Around 30% of UAE residents would consider buying an EV to contribute to the green transition and believe that they offer better value for money than traditional vehicles in the long run.[15]
People in the age group of 20-25 are more likely to be influenced by environmental factors and can be the youngest potential adopters. There have been hefty investments to reduce the charging time of EVs, providing further incentives for consumers to adopt EVs.

#9 THAILAND
Strong stakeholder engagement driving EV adoption
Often referred to as the “Automotive Hub of Asia,” Thailand has witnessed the flourishing of its automobile industry over the years. The industry contributes significantly to its GDP. (See Figure 24 for a snapshot of the Thailand population.)

At present, EV penetration is low, but it is encouraging to note that almost half the population would prefer an electric vehicle in the years to come (see Figure 25). To sustain this enthusiasm, Thailand will need active government intervention and stakeholder engagement. Recent progress is noteworthy. There has been a concerted push to fast-track EV adoption in the country. State-run companies, academic institutions, government agencies, and automotive associations are taking the lead in electrifying the vehicular fleet, particularly in the area of public transportation.
The Thailand government has planned consistent efforts for building the country’s charging infrastructure. The Ministry of Industry, for example, targets the setting up of charging stations within a maximum 50- to 70-km radius in the years to come. To bolster this, three state enterprises — Electricity Generating Authority of Thailand (EGAT), Metropolitan Electricity Authority (MEA), and Provincial Electricity Authority (PEA) — have joined to support investments in EV charging infrastructure.
With EGAT, the Ministry of Higher Education, Science, Research and Innovation and several academic institutions have collaborated to form the Thailand Energy Storage Technology Alliance (TESTA), which has the objective of revolutionizing local storage technology, a key pillar of electric mobility.
Thailand, therefore, is set for accelerated growth in EVs in the next five to 10 years, with increased investments from local and Thai investors coupled with government incentives. The government’s National Electric Vehicle Policy Committee has set the target of EV sales penetration at 30% by 2030.

#10 MEXICO
Urgent need to tackle rising pollution propelling EV push
Among the most populous countries in the world, Mexico is riddled with high travel times and air pollution. While the solution to both problems lies in electric mobility, only 5% of consumers would prefer an EV in the years to come.[16] Government incentives and private investment are required for a strong push toward electrification of the Mexican fleet. (See Figure 26 for a snapshot of Mexico’s population and Figure 27 for an overview of the country’s EV market.)

Understanding the criticality of its role, the Mexican government has developed a roadmap for electric mobility. Municipal tax exemptions and pollution control inspections are incentivizing locals.
Further, gasoline prices are on the rise, which has further bolstered sales of electric and hybrid vehicles. Private automotive players such as BMW and Nissan are making inroads in the country as well.
However, a lack of large-scale government support and limited charging infrastructure are key concerns. For each charging point in Mexico, there are 31 EVs, which is a dismal number compared to the EU average of 13. Moreover, the charging points are concentrated in smaller pockets, so there is an additional challenge for widespread access.
Notably, Mexico City is part of the Zero Emission Bus Rapid-deployment Accelerator (ZEBRA) initiative, focused on zero-emissions public transport in mainstream cities across Latin America. While infrastructure is a challenge, there is a clear understanding of the need for EVs in Mexico.
The future is encouraging, with General Motors announcing plans to infuse more than US $1 billion in an EV plant that will commence commercial production in the beginning of 2023.[17] This investment also envisages capacity for battery packs, electric motors, and other components, and is the first of its kind in Mexico.

#11 INDIA
Strong government push driving EV adoption
India is uniquely positioned in the EV space, with high customer adoption in a few segments. The current penetration rate of less than 1% is not encouraging, but given the country’s ambitions and capacity commitments, it might turn out to be the dark horse in the EV race. (See Figure 28 for a snapshot of the population in India and Figure 29 for an overview of its EV market.)

The Indian government’s Faster Adoption and Manufacturing of Hybrid and Electric Vehicles II (FAME-II) policy is one of the most important regulatory factors driving the EV push. Although current EV infrastructure is barely present, both local and global players have placed big bets on setting up adequate EV infrastructure in the coming two to three years. A rising middle-class population, government’s push to reduce carbon emissions, and increasing fuel prices are some other factors driving EV adoption.
However, EV adoption has been higher for two-wheelers and three-wheelers in India in comparison to passenger cars, which have not had much traction. A lack of proper road connectivity, long charging times, and infrastructure constraints have funneled penetration in favor of two- and three-wheelers in the country.
The Indian government is providing several financial incentives to OEMs in EV manufacturing, which have been passed down to customers at the point of purchase. However, the lack of adequate charging infrastructure has restrained customers from shifting toward EVs, which is usually a preferred second car choice for aspirational consumers in the country.
A lot of nonfinancial incentives have been provided for EVs, which has further spurred adoption. Given India’s demographics, the shift will, however, be led by the metropolises of Delhi, Mumbai, Bengaluru, and Chennai before it eventually trickles to other parts of the country. The lower cost and a preference of customers to travel smaller distances on bikes have led to faster adoption of two-wheelers. Players like Ola and Ather have already sold out their first batches of EV bikes, and large OEMs like Hero, Honda, and TVS have shifted their focus to two-wheelers as well.
India’s prominence in the global space is reflected in its mission to play an important role in the EV space. It remains to be seen if plans put in place materialize soon for the country to achieve its targets.

#12 BRAZIL
Rising fuel prices, cost of ICE vehicles not enough to spark Brazil’s EV market
A developing economy that has seen one of the lowest GDP per capita growth rates during the pandemic (-5%), Brazil is far behind other nations in EV adoption. Fuel prices are surging at the rate of 44% year-on-year in 2021,[18] but despite the increased costs, the Brazilian government has not been able to shift the momentum toward EVs. (See Figure 30 for a snapshot of the Brazil population and Figure 31 for an overview of the EV market.)

Awareness of the problems from ICE vehicles in terms of pollution and emissions has been growing among consumers.
However, limited spending power and sparse charging infrastructure has hamstrung adoption of EVs.
The key reason for the government’s inability to shift its focus to EVs is the country’s success in reducing its carbon footprint using biofuels. Brazil is planning to explore more opportunities for sustainable vehicles using biofuels. Apart from this, the nation cannot shift abruptly to BEVs, as current consumers are unable to afford them and investment in recharging infrastructure is uncertain on the part of governments and OEMs.
Only around 1% of cars on the road in 2021 were hybrid or electric. The modest figure is mainly due to high acquisition costs and the lack of infrastructure, as the vehicles depend on supply networks and specialized chains for maintenance. A lack of regulation and of a national consensus on the role of EVs have been notorious in the nation, so there is no dedicated charging infrastructure in place. And few OEMs are willing to tackle the high investments and risks of the new infrastructure required for adapting manufacturing plants to BEV-native architecture.
That said, recent government measures in terms of financial benefits have sparked a hope for growth of EV, with 68% of consumers saying that their next vehicle is likely to be electric, as reported by Statista. Brazil’s biofuel ecosystem for vehicles will determine the path for electromobility in the long term, and the nation must expedite its policies to compete with similar and developed economies across the world.

#13 INDONESIA
Strategic advantage and incentives sparking EV push
Indonesia holds one of the largest nickel reserves in the world, a key component of the lithium-ion battery cells driving the EV revolution. This gives the country a major strategic advantage in EV expansion.
As part of its EV roadmap, the country seeks to become a major EV market by 2030. (See Figure 32 for a snapshot of the population of Indonesia and Figure 33 for an overview of the EV market.) To this end, the Indonesian government has introduced various incentives, such as the Positive Investment List (PIL), which promises a host of incentives for companies making investments in the EV space.

These incentives include ease of license procurement, coupled with lucrative tax incentives such as a 0% tariff on luxury vehicles that adhere to zero-emissions technology standards.
Additionally, the country is witnessing aggressive urbanization and an increasing share of youth among its population. Hence, the environment is conducive to rapid expansion of EVs; still, there needs to be a consistent infusion of capital, time, and efforts. According to the Coordinating Minister for Maritime Affairs and Investment Luhut Binsar Pandjaitan, Indonesia requires US $35 billion to build and scale its EV ecosystem.[19]
Challenges around supporting infrastructure in Indonesia prevail: as of November 2021, only 219 charging units were built across 185 locations.[20]
At the same time, given the strategic advantage around its nickel reserves, government incentives, and interest from private investors, the country is poised for strong growth in the EV sector. Toyota Indonesia, for instance, plans to construct a battery assembly plant starting in 2022, while LG has committed US $9.8 billion toward EV battery cell manufacturing,[21] allowing it to benefit greatly from the PIL incentives.

#14 VIETNAM
Strong automotive foundation spurring shift toward EVs
Along with environmental concerns, a key driver of Vietnam’s EV push is likely to be its massive Internet-savvy population. About a third of Vietnam’s consumers report they are likely to purchase an EV.[22] (See Figure 34 for a snapshot of the Vietnam population and Figure 35 for an overview of the EV market.) However, much remains to be done to leverage this potential. While Vietnam offers preferential tax programs for eco-friendly EVs, there are no lucrative government incentives for EVs.

Notably, Vietnam was the first country in Southeast Asia to host an EV manufacturing company. However, the EV sector has since grown sluggishly. Traditionally, Vietnam has not been very strong in manufacturing. For instance, engine components are designed and manufactured overseas and shipped to Vietnam. There is, however, growing interest among private players in the country, and VinFast, Kia, Mercedes-Benz, and Toyota are all placing bets on the Vietnam EV market.
Realizing the need to play an active role in EV expansion, the Vietnam government has exempted electric cars from registration fees for three years and reduced the excise tax on BEVs (of nine seats or fewer) to 3%, starting in March 2022.[23]
But to further enable electrification, the government’s focus must be on leveraging the interest of private players through policies centered around friendly taxes and ease of production, as in many other markets. Given that there are no concrete policy measures to boost manufacturing of EVs in Vietnam at present, apart from lower excise tax, the road to electrification remains challenging.

#15 SOUTH AFRICA
Nonexistent EV market likely to grow slowly in coming years
South Africa’s EV market is almost nonexistent, with fewer than 1,000 cars currently on the road. (See Figure 36 for a snapshot of the population of South Africa and Figure 37 for an overview of its EV market.) However, it is expected to grow in the next decade due to multiple government initiatives to reduce carbon emissions and combat global warming by catalyzing the EV sector.

Such low EV penetration is largely due to the government’s limited focus, shrinking GDP per capita, and high up-front costs of EVs coupled with a poor electricity supply. The ongoing challenge to maintain constant power supply due to below-potential electricity generation makes consumers wary of purchasing BEVs.
However, there is an opportunity for increased sales of hybrid vehicles, as they can be powered by petrol or diesel when not using the electric motor. Further, import duties and taxes account for 45% of the cost of imported EVs, which is significantly higher than that for conventional fuel vehicles.
Currently, South Africa has 250-300 charging stations, with approximately one charging station for every four EVs in the country, giving it one of the highest station-to-EV ratios in the world. However, a lack of local purchase incentives combined with continued import duties will limit the uptake of EVs in the country and the potential for local production due to the lack of a market to offer EV producers some support.
To reduce the risk of electricity deficits, the government has amended Schedule 2 of the Electricity Regulation Act, lifting the license-exemption cap for generators to 100 MW. This is expected to bring in investments in the power sector and could benefit the demand for EVs as supply of electricity stabilizes.
In March 2021, the UK government selected 10 projects in South Africa to receive ZAR 64 million in funding to help decarbonize Johannesburg and Nelson Mandela Bay, which could boost development of the EV infrastructure in the country.
Companies like Audi, Mercedes, Nissan, and Opel are also launching full EV models in the country. This will attract investment in charging stations, which in turn will help attract the next tier of buyers.
Overall, the adoption of EV will be quite slow in South Africa as natural gas-powered vehicles could be the fastest, most cost-effective, and easiest route to reducing emissions of South Africa’s transport sector. However, there is growth potential for hydrogen fuel cell vehicles, as the country is more likely to adopt more affordable LNG-powered vehicles to cut emissions.

CONCLUSION
Policies, especially on subsidies and infrastructure, will spur EV adoption in all markets
Looking at all the countries we analyzed in GEMRIX 2022, it is clear that the trajectory of EV readiness is determined by the year in which efforts began, average income of the population, government incentives, and the orchestrated buildup of charging infrastructure. Every country can adopt EVs in the coming years, if the respective government wants to do so and invests accordingly.
In countries with higher incomes, subsidies are the primary tool to level the playing field between ICEs and EVs during the transition period, and customers are likely to choose EVs due to their environmental benefits. In those countries, availability of public fast-charging infrastructure will be the key determinant going forward.
In countries with lower average incomes and lower e-mobility readiness, subsidies are required to make e-mobility affordable by lowering TCO significantly below those of ICE vehicles in the short term.
This will spark interest and make up for current inconveniences in infrastructure. In the midterm, e-mobility followers can leapfrog EV development by quickly investing in the required fast-charging networks.
Technological development will continue to push EV costs below those of ICEs and drive customer decisions toward electric mobility.
Notes
[1] Banerji, Sumant. “The Hustle Is On: EVs Corner 46% of 3Ws; Over 2.5% of All Automobile Sales in India in FY22.” The Economic Times, 9 April 2022.
[2] Srivastava, Pradeep, et al. “Forecasting Penetration of Electric Two-Wheelers in India: A Bottom-Up Analysis.” TIFAC/NITIA, June 2022.
[3] Banerji, Sumant. “The Hustle Is On: EVs Corner 46% of 3Ws; Over 2.5% of All Automobile Sales in India in FY22.” The Economic Times, 9 April 2022.
[4] Howard, Bill. “Survey: 23% of Americans Would Consider EV as Next Car.” Forbes Wheels, 8 October 2021.
[5] Fischer, Justin. “Electric Vehicle Sales and Market Share.” YAA, 26 April 2022.
[6] Kane, Mark. “Norway: Plug-In Car Sales Maintain 85% Share in July 2021.” InsideEVs, 4 August 2021.
[7] Kvisle, Hans Håvard. “The Norwegian Charging Station Database for Electromobility (NOBIL).” World Electric Vehicle Journal, Vol. 5, 2012.
[8] Kawakami, Takashi, et al. “China Led World with 500,000 Electric Car Exports in 2021.” Nikkei Asia, 8 March 2022.
[9] “Net Electricity Generation in Germany in 2021.” Fraunhofer Institute for Solar Energy Systems ISE, 3 January 2022.
[10] “Statistical Review of World Energy.” BP, 2022.
[11] “How Many Smartphones Are in the World?” Bankmycell.com, accessed July 2022.
[12] “US Carmakers Aim for 40%-50% EV Sales by 2030.” Electrive.com, 5 August 2021.
[13] Shepardson, David. “US Automakers to Say They Aspire to Up to 50% of EV Sales by 200 — Sources.” Reuters, 4 August 2021.
[14] “Ford Targets 50 Percent EV Sales by 2030.” Ratchet + Wrench, 10 March 2022.
[15] “Time for the Middle East to Go Electric? How and Why?” Press release, Zawya, 14 April 2022.
[16] “Fewer People Buy Electric Cars in 2021.” Horsepower, 25 March 2021.
[17] Carney, John. “GM Announces $1 Billion Investment in Mexico to Build Electric Vehicles.” Breitbart, 30 April 2021.
[18] “Rising Fuel Prices Not Enough to Spark Brazil’s EV Market.” Automotive World, 2 February 2022.
[19] “Indonesian Electric Vehicles Industry Development Gains Momentum.” Indonesian AHK, 1 December 2021.
[20] “187 EV Charging Stations Are Fully Operated.” IDN Financials, 15 October 2021.
[21] “Indonesia and LG Group Sign $9.8 bln EV Battery MOU.” Reuters, 29 December 2020.
[22] “The Future of Electric Vehicles in South East Asia.” Vietnam+, 19 July 2022.
[23] Lang, Truong. “Can Vietnam ‘Pick Up the First Batch’ of the Wave of Electric Cars?” Viettonkin, 7 June 2022.
DOWNLOAD THE FULL REPORT
