13 min read • Energy, Utilities & Resources
The buzz about energy data & where to find it
Facilitating cross-sectoral exchange of energy data


Executive Summary
EXPLORING OPPORTUNITIES IN ENERGY DATA
Increased electrification across society to meet climate targets, paired with European and local legislation, has put pressure on every level of the grid, while creating opportunities for existing and new market players. In addition, end consumers are looking for active opportunities to valorize their energy-efficiency investments, like solar photovoltaic (PV), heat pumps, electric boilers, and home batteries. Service providers are eagerly scouting for new opportunities to create value by leveraging the skyrocketing amounts of data that accompany these changes.
Although the opportunities for commercial energy market players to offer energy services are vast, one key barrier is preventing fast innovation: access to energy data. The demand from existing and new market players has increased steadily and continually and will continue to do so.
In this Report, we identify systems and parties who are trying to retrieve the data and explore relevant energy data use cases. We examine these cases through three different lenses: how to facilitate energy data access through smart meters, how to meet governance requirements, and finally how to incorporate the IT system perspective. The opportunities are indeed huge — catching and exploring them is the challenge.
1
MAXED-OUT GRIDS & NEW OPPORTUNITIES DRIVE DEMAND, NEW INITIATIVES FOR ENERGY DATA
The energy transition is driving the uptake of renewable energy sources and the electrification of overall energy demand. The resulting steep increase of intermittent energy production and new electric loads are putting pressure on every voltage level in our energy networks (see sidebar “Addressing the problems of increased consumption and renewable energy”).
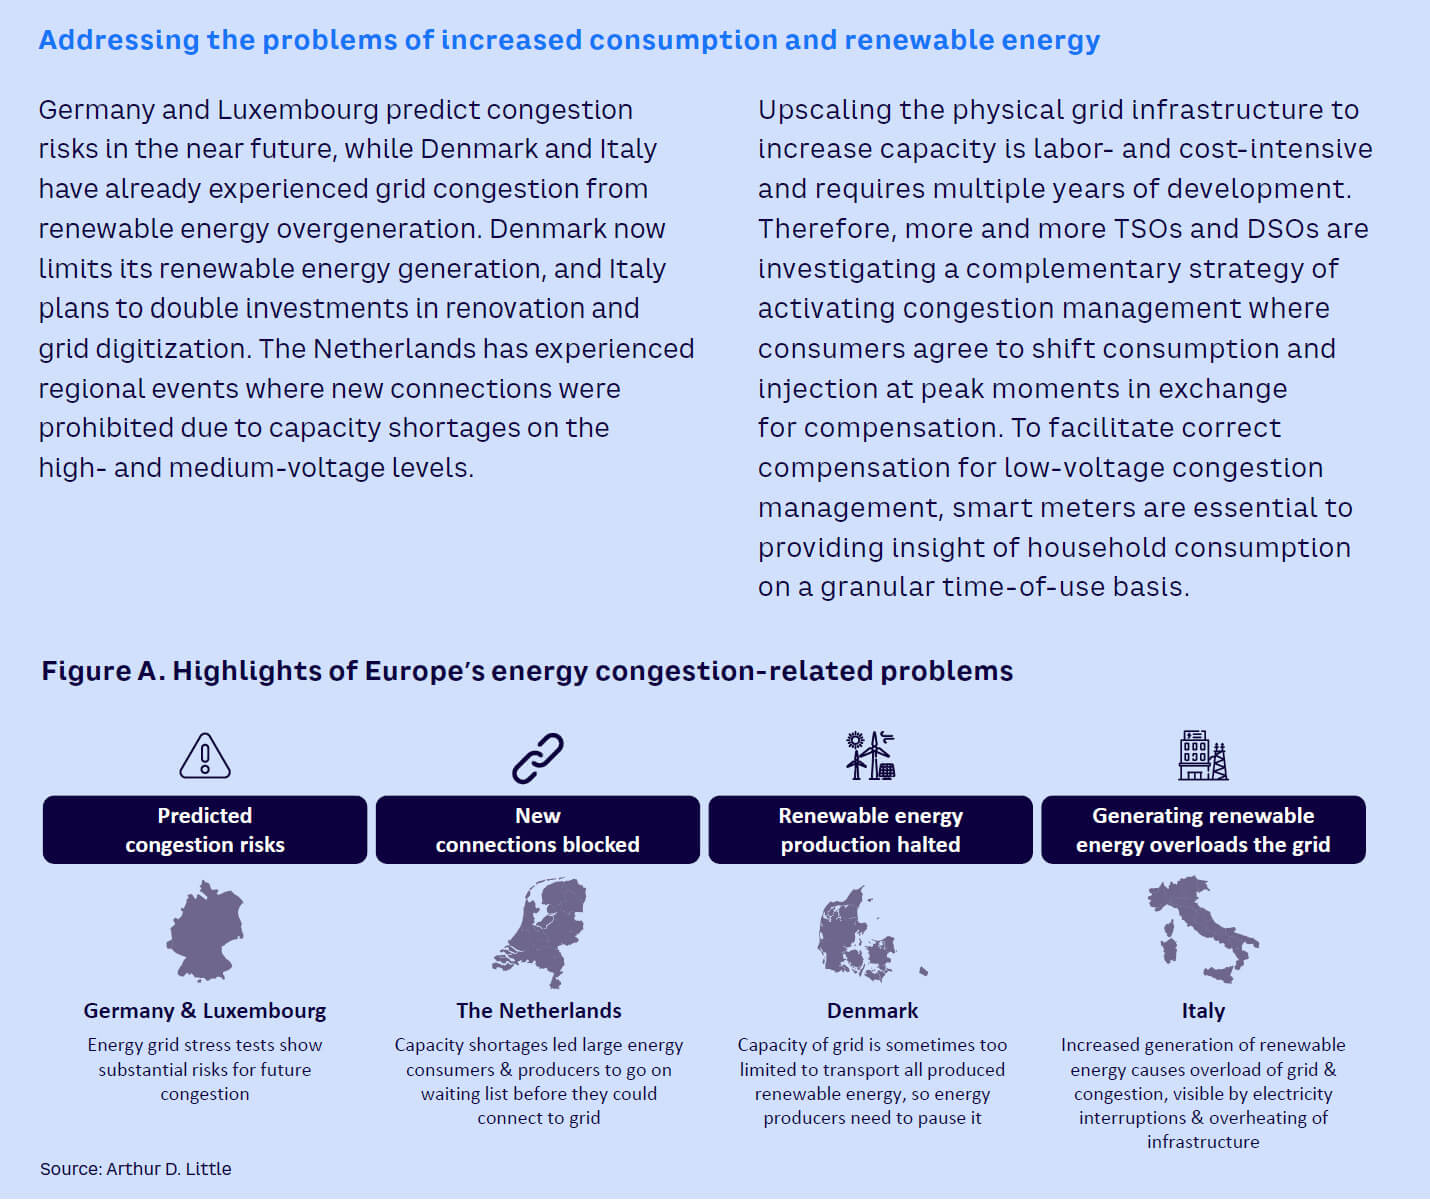
Legacy gold-plated distribution networks have reached their limits of capacity, pushing many distribution system operators (DSOs) and transmission system operators (TSOs) into unknown territory, as the focus shifts away from maintenance and toward new asset investments and digital innovations. Indeed, the energy transition is attracting many new players to the game who are putting increased pressure on the grid players to access and draw insights from data that measures energy consumption.
These constraints not only limit the economic growth potential of certain regions; they also hamper the energy transition as clean energy struggles to find its way to the grid. Meanwhile, new loads for e-mobility, like charge poles, and data center infrastructure are being impeded in already highly regulated areas.
New players entering the market can help enable the ecosystem to resolve the emerging grid challenges. They can offer services to manage energy consumption, which provides greater insight for the end clients and market parties, ultimately creating more energy flexibility in the market (see Figure 1).
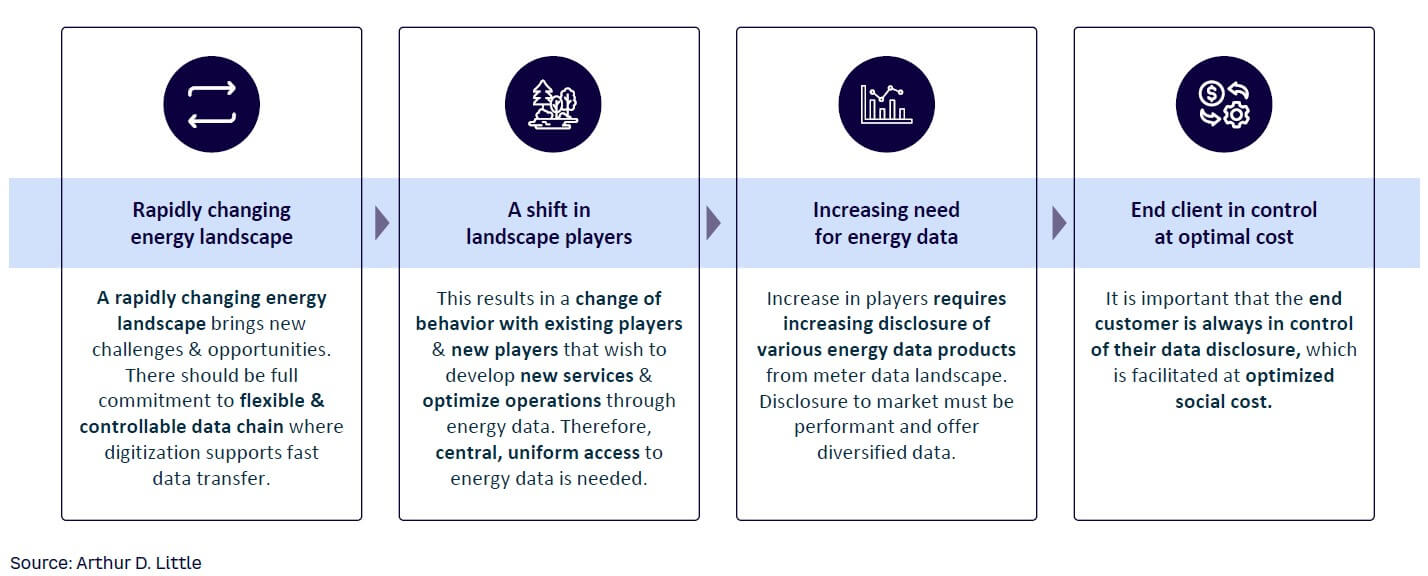
The changing landscape calls for existing players to expand or adapt their offerings. Both new and existing players typically need access to metering data and other diversified energy data products. Going forward, data access and support for developing data-sharing use cases are necessary to provide value-adding services.
While access and participation to build energy data use cases often exist for established system market parties and processes, new parties keen to build on energy data insights find their access is often very cumbersome or is not facilitated at all.
COUNTRIES TAKING INITIATIVES TO UNLOCK ENERGY DATA TO THE MARKET
Across the globe, countries are centralizing their energy data as one step toward easier facilitation of distributing energy data.
There is no one-size-fits-all approach that applies to every market when considering all the possible data-sharing architectures. Legacy processes and legislation are the main drivers of data-sharing market designs in each country. Some noteworthy trends include:
-
In most countries, the smart meter data value chain is mostly owned and operated by DSOs and/or TSOs, where in some cases centralized entities standardize communication (e.g., Atrias in Belgium, Australian Energy Market Operator in Australia, SII in Italy).
-
In Italy, a central system (SII) managed by a public company was created in 2010 (but still not finalized) to store data from end consumers (both gas and electricity); a second wave of smart meter rollout is ongoing and will allow for an increase in granularity of data, opening new opportunities for data valorization.
-
In Nordic countries, centralization is taking place across borders. Enacting central hub interaction reduces market-entry barriers for commercial players who do business in the region. In addition, centralization offers possibilities for distributed energy proliferation via renewables and demand-side flexibility.
-
Privacy risks accompany the increased data exchange, necessitating a transparent overview of the data shared with market parties. New entities are created to host central consent registers to log data authorizations, which allows commercial entities to use the energy data of end clients.
-
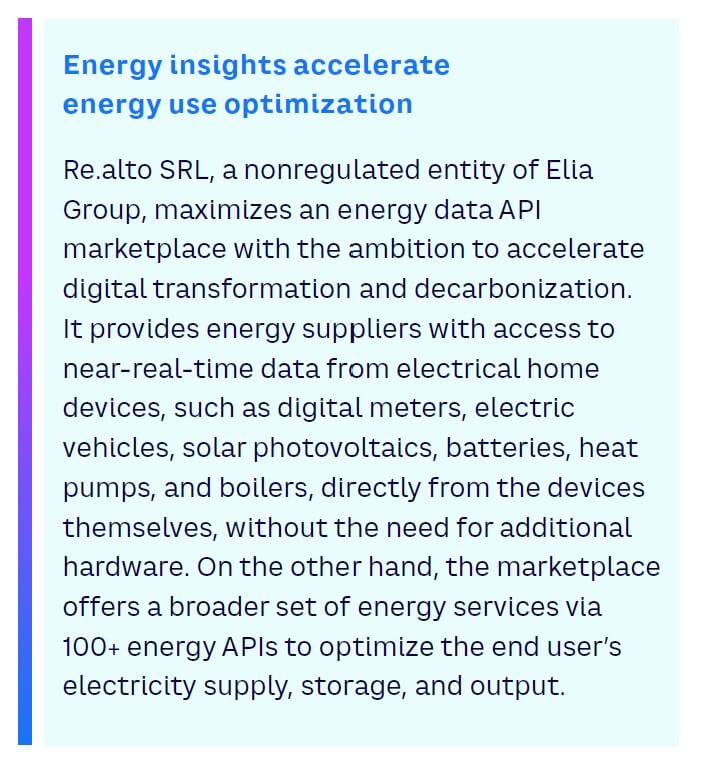
A review of the data collection reveals an increasing variety of different data types, which provides flexibility and congestion services such as voltage and frequency data, combined with price signals. The data opens a door leading away from the core business of metering data toward diversified commercial energy data offerings. However, this change often conflicts with the regulatory roles and responsibilities of grid operators. TSOs and/or DSOs are introducing nonregulated entities to avoid regulatory conflicts and enter new services like re.alto and EnergyDataDK, which was developed by the Technical University of Denmark (DTU) and its partners (see sidebar “Energy insights accelerate energy use optimization”).
2. WHERE TO FIND PROMISING ENERGY DATA SOURCES
Energy data can originate from two major distinct sources:
-
Traditional system market players — grid operators, balance responsible parties, energy suppliers.
-
Nontraditional market players — the real estate sector, original equipment manufacturers (OEMs), e-mobility providers.
Both sources are introducing new products and services, generating a richness of energy data relevant to the operations of the evolving energy landscape. They can use the raw data that is directly disclosed at the smart meter or the validated data that is transferred via the data chain, depending on the product or service.
In some countries, it is or will be required by law for traditional data registers to provide certain data products to the market for free. This is happening already in the Netherlands, where grid operators, closed distribution system operators, and parties responsible for meters must disclose specific energy data products for free.
DATA FROM TRADITIONAL SYSTEM MARKET PLAYERS
Consumption & injection registers
By far, the most valuable energy data source comes from the electricity consumed by and injected into the grid. As we are transitioning toward a supply-driven energy landscape (an increase of variable, weather-dependent energy sources) while also becoming more electricity-intensive, there is a growing need for granular and near-real-time energy data to perform effective and automated demand-side control.
Technical registers
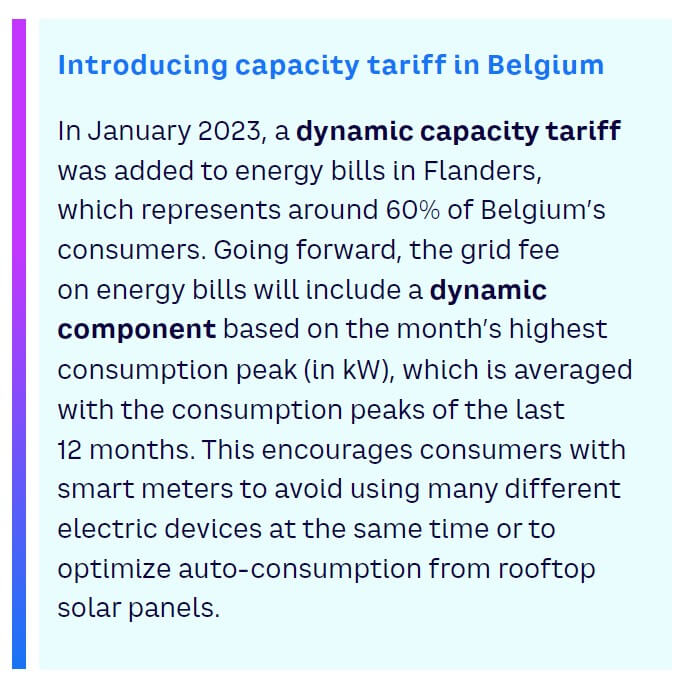
The introduction of smart meters has given system market parties insight into a goldmine of consumption data. Collecting technical data such as meter event information (e.g., outages), voltage information, and peak power can provide a grid company with a 360-degree view of the meter that supports asset management and system operations. Real-time voltage information helps grid operators visualize and monitor the low-voltage network and perform data-driven congestion management. On the other hand, peak power data shows when household consumption is highest, leading to energy allocation based on new mechanisms, such as dynamic capacity tariffs. This method will be introduced in Flanders, Belgium (see sidebar “Introducing capacity tariff in Belgium”).
Asset data
In addition to energy usage information, asset data about the meter is useful for system market parties, mainly for system operators. It includes general meter information such as its age, type, and capacity; it also shares schedules of recent and upcoming software updates and meter maintenance. This data allows system market parties to anticipate potential problems with reading meter data.
DATA FROM NONTRADITIONAL MARKET PLAYERS
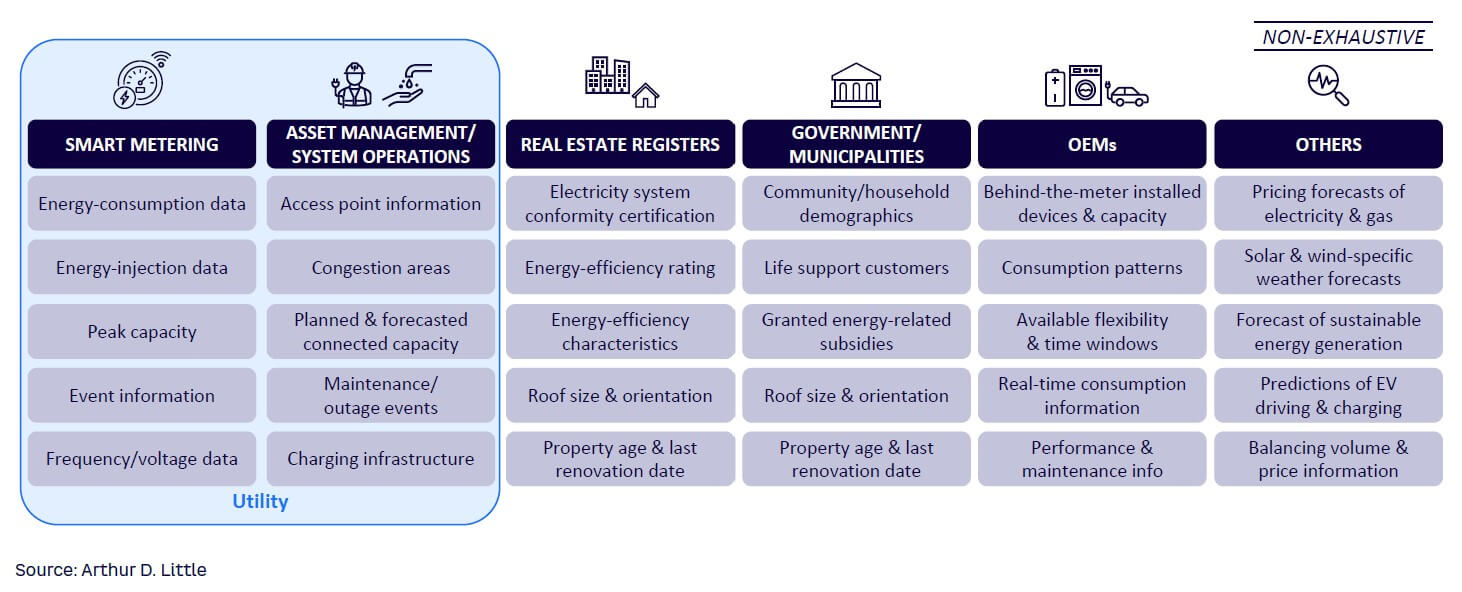
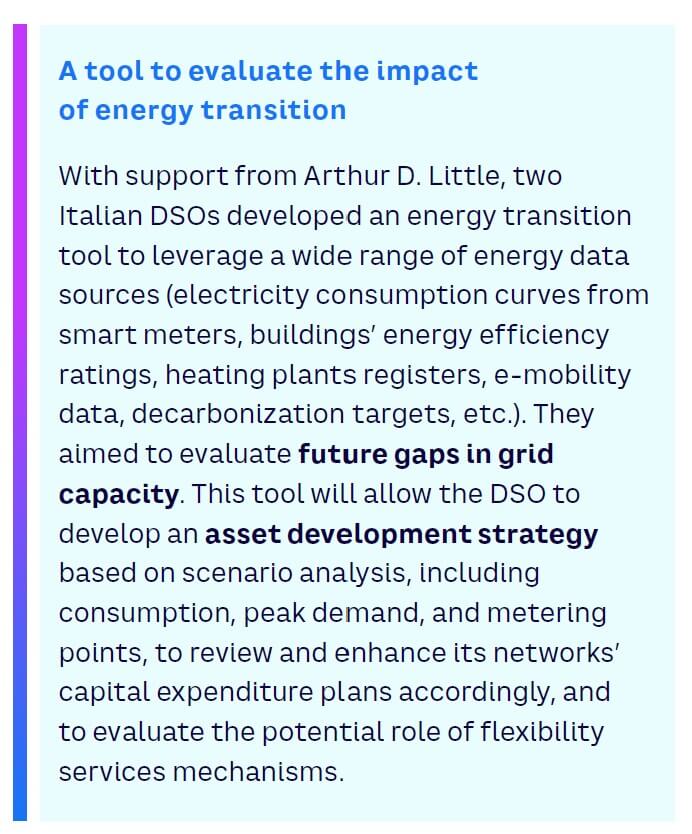
Diversifying data types allows new market players to combine metering data with external data to introduce new services. New sources of energy data are being unlocked; these include real estate registers and government demographic registers. OEMs provide another source of data, especially from heat pumps, electric boilers, washing machines, and charge poles (see Figure 2 and sidebar “A tool to evaluate the impact of energy transition”).
3
DESIGNING A FUTURE-READY SMART METERING LANDSCAPE
Understanding smart meter data sources is key to retrieving the right data for its corresponding use case:
-
Energy-efficiency monitoring. Green loans are granted based on a building’s post-renovation energy-efficiency improvements. The required data points don’t need to have high granularity; they do not need to be real-time or instantly available, either. Instead, efficiency improvements can be identified and assessed by creating an energy consumption profile. An energy consumption profile based on aggregated data taken before and after the renovations should be sufficient to identify and assess the energy-efficiency improvements.
-
Demand response. More granular data is needed to enable residential demand response, as these events can be triggered, for example, from 2 pm to 5 pm. Daily aggregated data will not be sufficient here. Typically, most European countries already take 96 meter readings per day (equal to one every 15 minutes), which enables effective demand-response market support.
-
Congestion management. A grid operator needs near-real-time or real-time voltage information on the street or household level to effectively enable local congestion management and initiate the necessary dispatch actions. Acquiring this data in a timely manner once a critical congestion event occurs is a key step in addressing the problem.
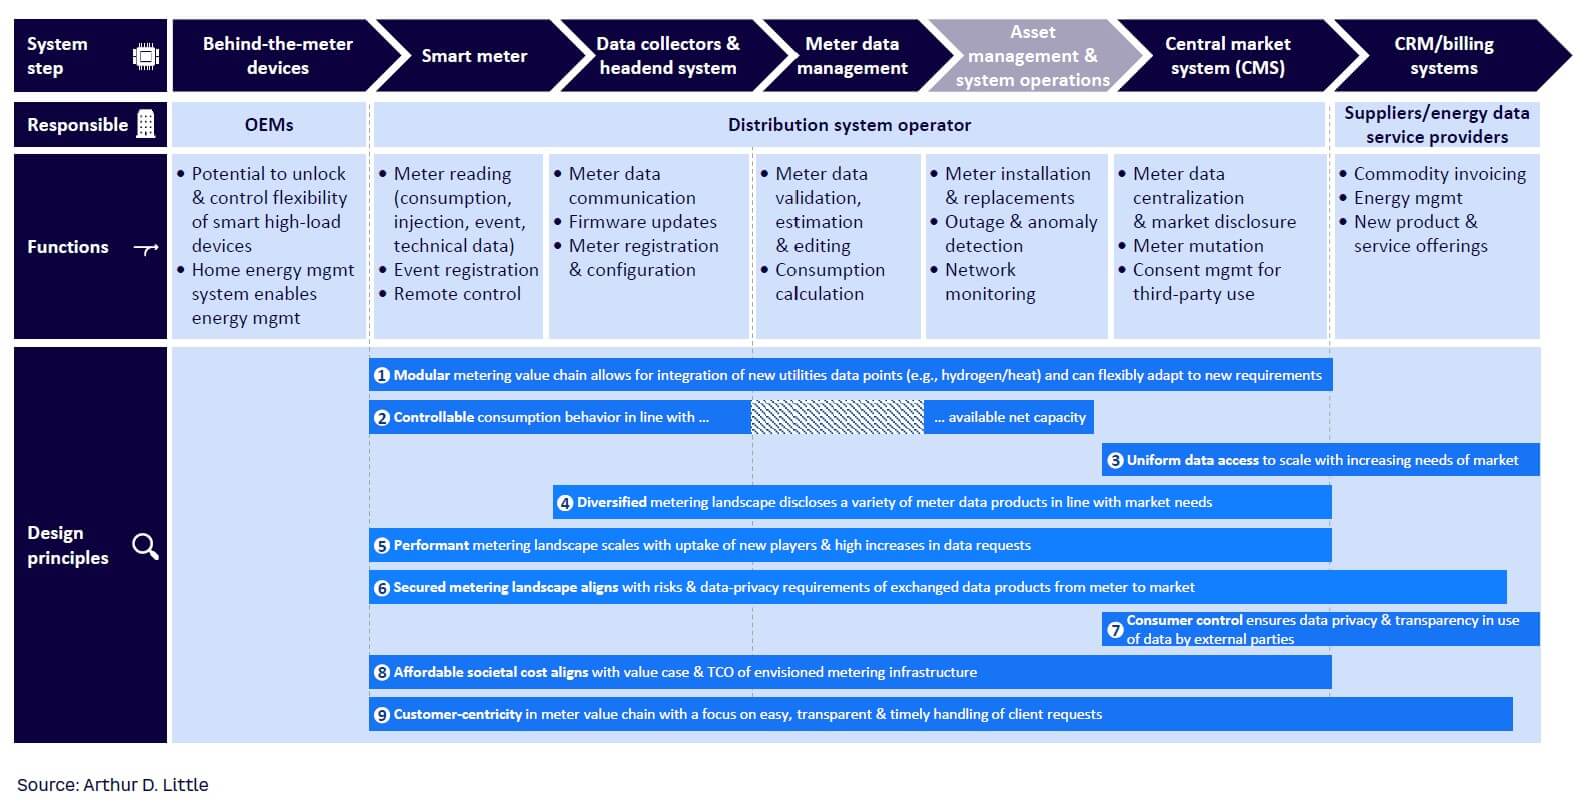
The principles above capture key design criteria for a future-ready smart meter data value chain (see Figure 3):
-
Modular metering value chain. The meter data value chain should be flexible enough to adapt to uncertain future scenarios and requirements in the energy landscape. It should allow for easy integration with system operations and asset management and facilitate the introduction of new utilities such as water, hydrogen, and heat.
-
Controllable. Introducing more variable and sustainable resources makes the energy landscape driven by supply, instead of demand. Monitoring and steering the behavior of end consumers will be required to optimally manage the grid and prevent power outages.
-
Uniform data access. Data must be equally accessible to all parties with permission to use it.
-
Diversified. Smart meters can disclose more than consumption data. Insights that focus on events, voltage, and generation can be shared to inform emerging use cases.
-
Performant. The architecture must be prepared and scalable to process increasing amounts of data.
-
Secure metering landscape. Cybersecurity should be central to both the processes and architecture, given the increasing integration of metering data into the system operations of strategic energy infrastructure. Ensuring data privacy across the entire chain from source to end user also relies on solid cybersecurity.
-
Consumer control. Full control and transparency to grant energy data access to commercial parties should be given to the consumer.
-
Affordable societal cost. Adapting the meter data value chain will trigger costs to optimize in line with the system’s needs and benefits.
-
Customer-centric. The customer’s touch points within the metering value chain should allow for simple, timely, and transparent handling, with a focus on self-service and first-line support enablement.
4
UNLOCKING ENERGY DATA — A GOVERNANCE VIEW
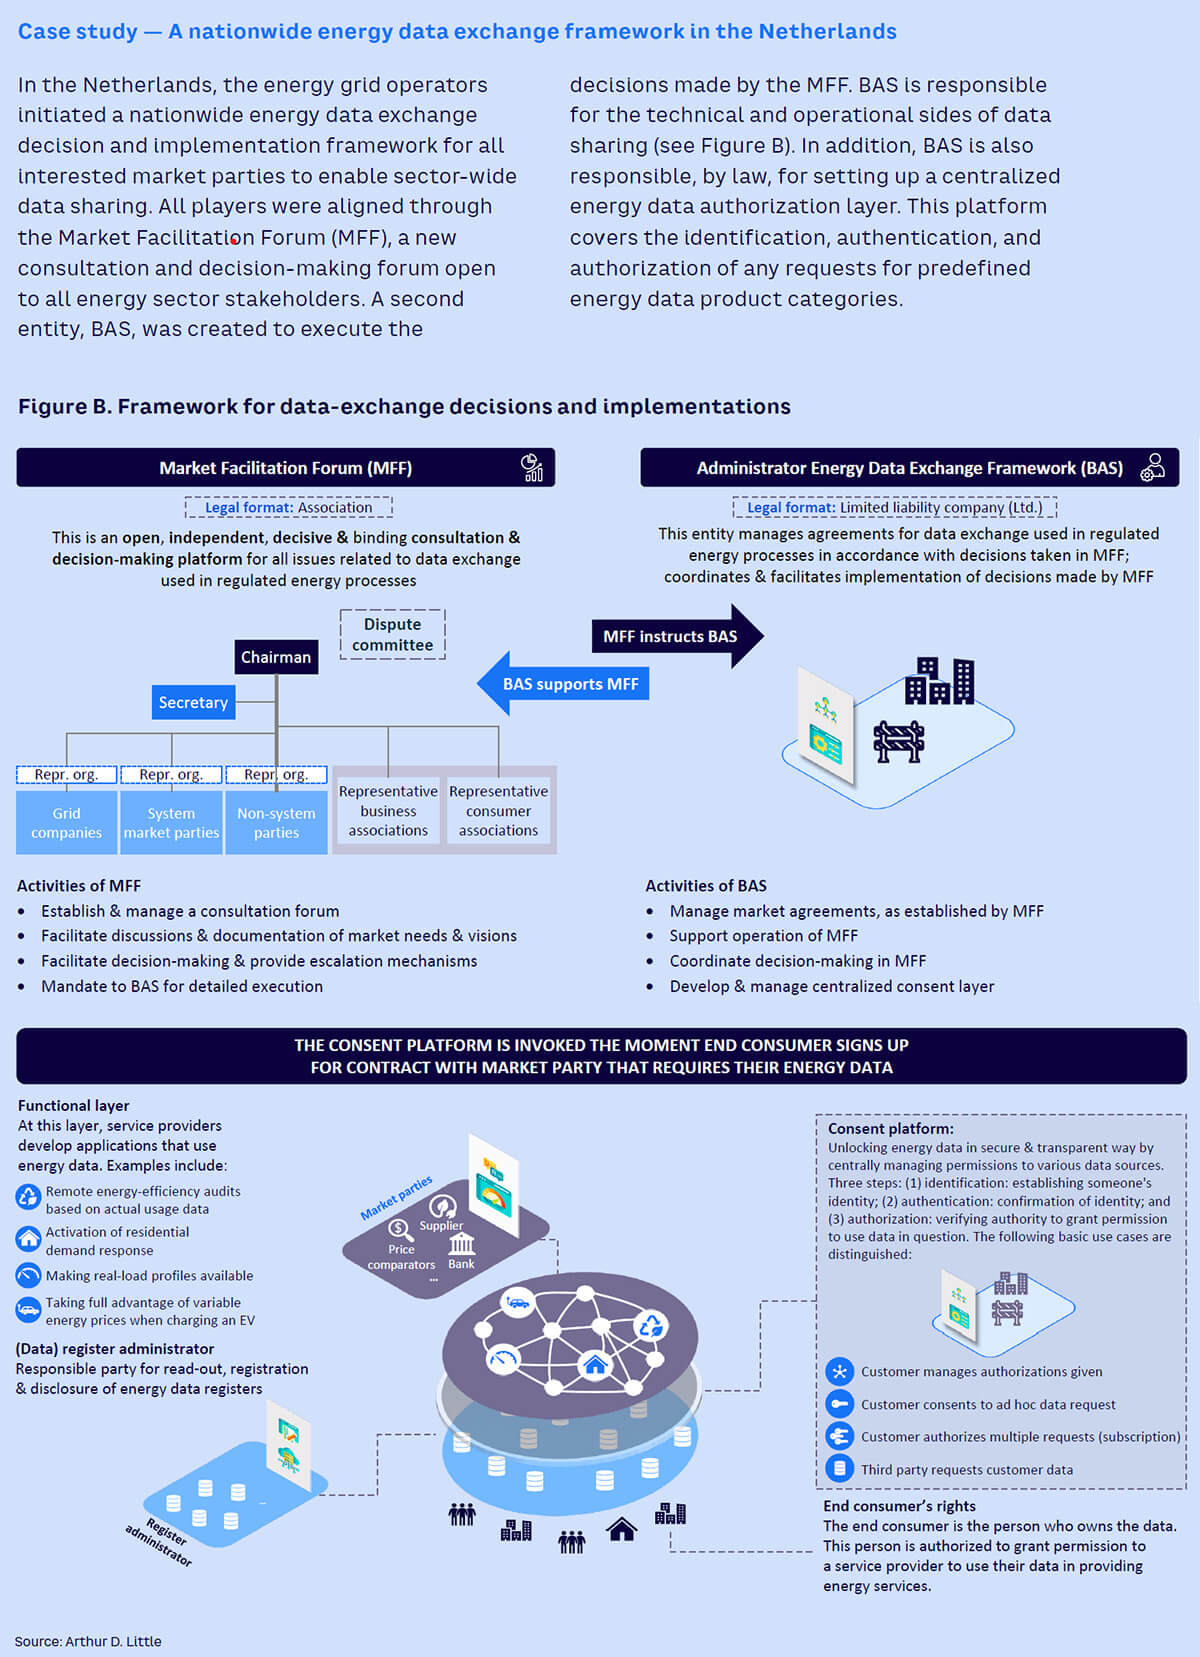
To meet the challenges of sustainability and customer-centricity, it is critical for energy network operators to collaborate with nontraditional partners, regulators, and competitors. This cooperation relies on consumer data from smart meters, but data sharing is currently difficult due to issues with quality, governance, confidentiality, and availability. The complexity and challenges can be overcome through a combination of collaboration and customer-centricity, often enabled by regulatory push. A regulatory framework is required to set legislative ground rules for collaboration and data sharing, which must be backed by robust customer data consent mechanisms and a cross-industry IT structure to support data exchange. The Netherlands has initiated a regulatory framework with these characteristics (see sidebar “Case study — A nationwide energy data exchange framework in the Netherlands”).
5
UNLOCKING ENERGY DATA — SMART METER ARCHITECTURE VIEW
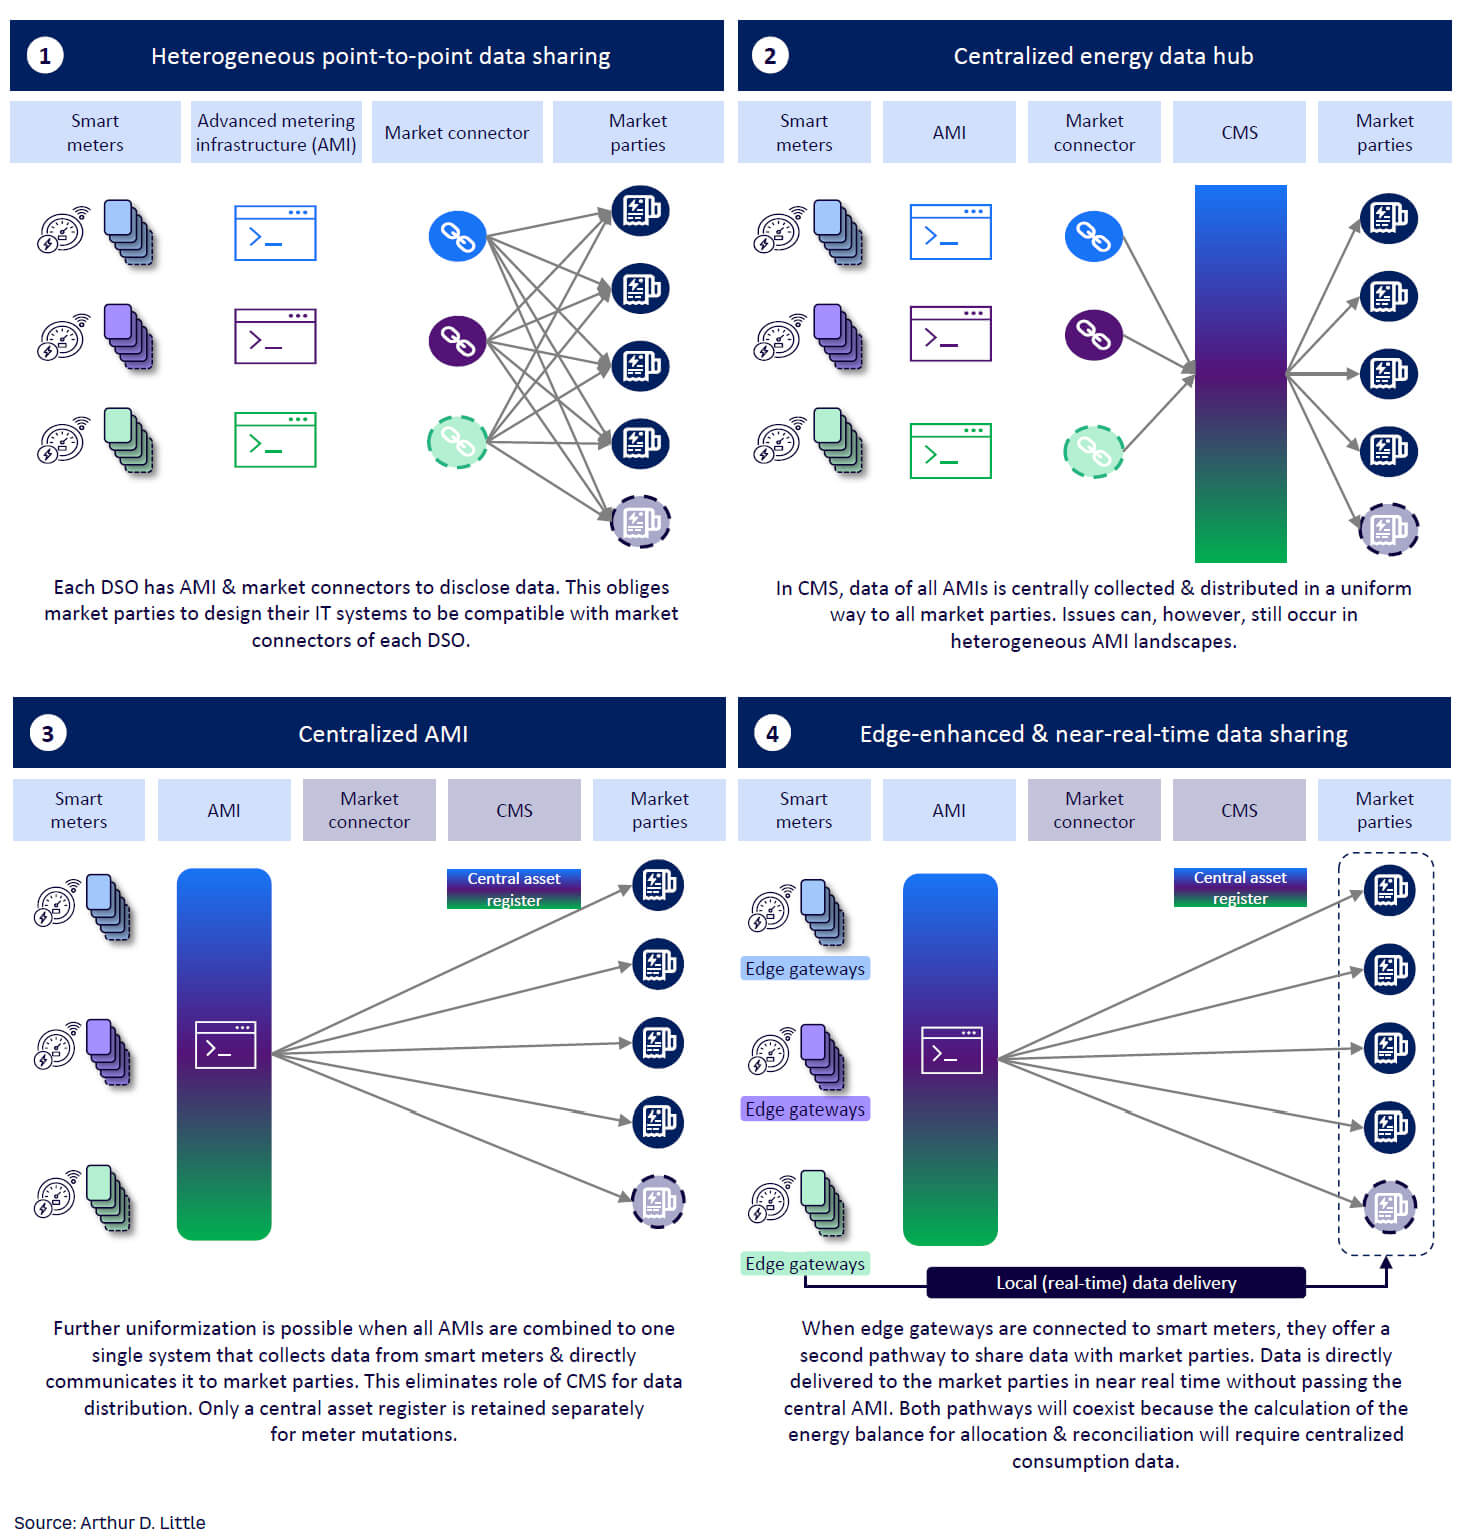
Four main metering landscape archetypes are presented below (see Figure 4), ranging from heterogeneous, slow, point-to-point data sharing to a highly homogeneous meter data value chain with local real-time data disclosure.
-
The first archetype displays a complex hetrogenous and often cost-ineffective setup. Meter data is delivered after a long delay to the market, where every market party requires a point-to-point nonstandardized integration with each individual DSO or other data-disclosing entity.
-
In the second archetype, the decentralized heterogenous point-to-point integrations are unified in a central market system (CMS), facilitating ease and uniformity of exchange across market parties. The process for incident analysis and handling data-exchange issues where data was not delivered is cumbersome because of the individual DSO’s customized Advanced metering infrastructure (AMI) landscapes, which enable two-way communication with the digital meters.
-
The third archetype is characterized by uniform data handling closer to the smart meters. All heterogenous decentralized AMIs are reduced to one uniform AMI functionality that collects data of all smart meters. This is possible through one central application operated by all data-disclosing entities, or multiple applications, operated by the individual entities, that run the same software and business logic. The central asset register from the central market system must be maintained in order to deliver data to the correct market parties. This register collects all the contracts between market parties and consumers as well as mutations such as moves and switches.
-
The last archetype introduces a local edge gateway on the meter. The gateway calculates and communicates, supported by edge technology, artificial intelligence, and Internet of Things, while the core meter’s tasks are limited to measuring the electricity flow. This offers the possibility for real-time data disclosure to support the introduction of new advanced applications. Additionally, local processing allows for offloading heavy centralized processes. Local processing lowers the risk for security breaches by avoiding duplications and dispersions of personalized data in centralized systems. The UK market has gateways already in place for pure communication purposes, but in the Netherlands, the commercialization of an edge gateway with extended functionality is being explored.
The communication functionality of the CMS and the centralized AMI focuses on data export. A parallel data lake can be constructed to perform further calculations and create aggregates with the collected data without interrupting the core data-export processes. This system needs to be highly available and high-performing, accessible via APIs by many concurrent users. Similar API structures are being used in open banking, as explained in the case study.
Regardless of structure, there is no doubt that the amount of collected data will significantly increase in the near future. Introducing a centralized consent platform to manage larger volumes of data is increasingly important. The platform’s process has three steps, which we refer to as IAA: identification (establishing someone’s identity), authentication (confirming their identity), and authorization (verifying authority to grant permission). The consumer receives a clear overview of all the authorizations he or she has given. In the case of the decentralized gateway structure, it is possible to have local IAA functionality to communicate data directly from the smart meter to the market party without passing through a central metering system.
CONCLUSION
CAPTURING ENERGY DATA OPPORTUNITIES
There is consensus that energy data will be the cornerstone in establishing a stable, secure future power supply. Rethinking how this data is unlocked and distributed to market participants in a uniform, transparent way should be a top priority. Failure to understand this landscape means jeopardizing the security and quality of the energy supply and missing new (commercial) business models. In this Report, we highlighted the need for better open data, explored traditional and new sources, showed the benefits of smart metering, and recommended setups for governance and architecture. Ultimately, multiple enablers are the key to maximizing the vast opportunities in energy data. Although specific regions, such as the EU, are forerunners in using energy data, the opportunities and challenges will be relevant across the globe. Key takeaways for market players include:
-
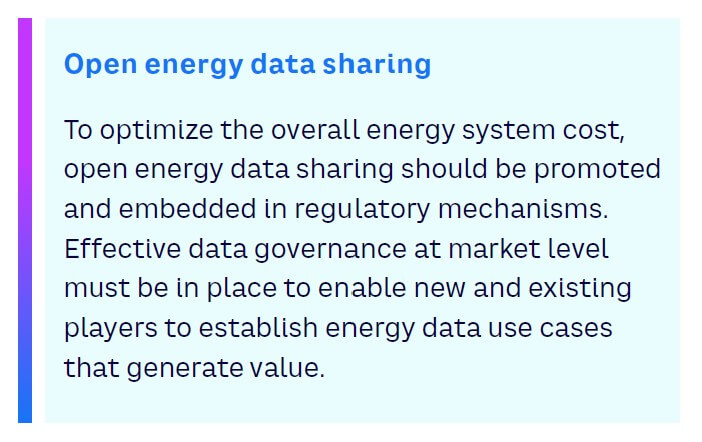
Open energy data sharing should be promoted and embedded in regulatory mechanisms to optimize the overall system cost of the energy landscape.
-
An effective data governance forum on market level accelerates collaboration and use case development and encourages joint decision-making among new and existing players.
-
Stricter privacy legislation will protect the end consumer and give them full control of their data. Investing in quality user experiences across the energy data value chain will promote participation and use case valorization.
-
End consumers will be pursued by third parties wanting to exploit inherent data value. This occurs beyond the energy sector, in financial services, automotive, telecoms, and others.
-
Countries are developing centralized consent management to enable transparency and control of energy data utilization; IT platforms facilitate end consumer IAA of energy data usage for products and services.
-
There is no “one size fits all” for data sources. Specific sources need to be tapped into based on use case. Understanding the energy data value chain and its possibilities and limitations is critical in assessing a new energy product or service’s viability.
-
Data register operators should focus on standardizing the end-to-end metering architecture with modularization and security at its core to keep pace with fast-evolving trends and higher numbers of data transactions.
-
Metering architecture must be redesigned to unlock real-time energy data use cases and support direct data distribution from the meter to the authorized market party. Maintaining central infrastructure will ensure calculation of the energy balance to perform allocation and reconciliation activities.
DOWNLOAD THE FULL REPORT
13 min read • Energy, Utilities & Resources
The buzz about energy data & where to find it
Facilitating cross-sectoral exchange of energy data

DATE

Executive Summary
EXPLORING OPPORTUNITIES IN ENERGY DATA
Increased electrification across society to meet climate targets, paired with European and local legislation, has put pressure on every level of the grid, while creating opportunities for existing and new market players. In addition, end consumers are looking for active opportunities to valorize their energy-efficiency investments, like solar photovoltaic (PV), heat pumps, electric boilers, and home batteries. Service providers are eagerly scouting for new opportunities to create value by leveraging the skyrocketing amounts of data that accompany these changes.
Although the opportunities for commercial energy market players to offer energy services are vast, one key barrier is preventing fast innovation: access to energy data. The demand from existing and new market players has increased steadily and continually and will continue to do so.
In this Report, we identify systems and parties who are trying to retrieve the data and explore relevant energy data use cases. We examine these cases through three different lenses: how to facilitate energy data access through smart meters, how to meet governance requirements, and finally how to incorporate the IT system perspective. The opportunities are indeed huge — catching and exploring them is the challenge.
1
MAXED-OUT GRIDS & NEW OPPORTUNITIES DRIVE DEMAND, NEW INITIATIVES FOR ENERGY DATA
The energy transition is driving the uptake of renewable energy sources and the electrification of overall energy demand. The resulting steep increase of intermittent energy production and new electric loads are putting pressure on every voltage level in our energy networks (see sidebar “Addressing the problems of increased consumption and renewable energy”).

Legacy gold-plated distribution networks have reached their limits of capacity, pushing many distribution system operators (DSOs) and transmission system operators (TSOs) into unknown territory, as the focus shifts away from maintenance and toward new asset investments and digital innovations. Indeed, the energy transition is attracting many new players to the game who are putting increased pressure on the grid players to access and draw insights from data that measures energy consumption.
These constraints not only limit the economic growth potential of certain regions; they also hamper the energy transition as clean energy struggles to find its way to the grid. Meanwhile, new loads for e-mobility, like charge poles, and data center infrastructure are being impeded in already highly regulated areas.
New players entering the market can help enable the ecosystem to resolve the emerging grid challenges. They can offer services to manage energy consumption, which provides greater insight for the end clients and market parties, ultimately creating more energy flexibility in the market (see Figure 1).

The changing landscape calls for existing players to expand or adapt their offerings. Both new and existing players typically need access to metering data and other diversified energy data products. Going forward, data access and support for developing data-sharing use cases are necessary to provide value-adding services.
While access and participation to build energy data use cases often exist for established system market parties and processes, new parties keen to build on energy data insights find their access is often very cumbersome or is not facilitated at all.

COUNTRIES TAKING INITIATIVES TO UNLOCK ENERGY DATA TO THE MARKET
Across the globe, countries are centralizing their energy data as one step toward easier facilitation of distributing energy data.
There is no one-size-fits-all approach that applies to every market when considering all the possible data-sharing architectures. Legacy processes and legislation are the main drivers of data-sharing market designs in each country. Some noteworthy trends include:
-
In most countries, the smart meter data value chain is mostly owned and operated by DSOs and/or TSOs, where in some cases centralized entities standardize communication (e.g., Atrias in Belgium, Australian Energy Market Operator in Australia, SII in Italy).
-
In Italy, a central system (SII) managed by a public company was created in 2010 (but still not finalized) to store data from end consumers (both gas and electricity); a second wave of smart meter rollout is ongoing and will allow for an increase in granularity of data, opening new opportunities for data valorization.
-
In Nordic countries, centralization is taking place across borders. Enacting central hub interaction reduces market-entry barriers for commercial players who do business in the region. In addition, centralization offers possibilities for distributed energy proliferation via renewables and demand-side flexibility.
-
Privacy risks accompany the increased data exchange, necessitating a transparent overview of the data shared with market parties. New entities are created to host central consent registers to log data authorizations, which allows commercial entities to use the energy data of end clients.
-
A review of the data collection reveals an increasing variety of different data types, which provides flexibility and congestion services such as voltage and frequency data, combined with price signals. The data opens a door leading away from the core business of metering data toward diversified commercial energy data offerings. However, this change often conflicts with the regulatory roles and responsibilities of grid operators. TSOs and/or DSOs are introducing nonregulated entities to avoid regulatory conflicts and enter new services like re.alto and EnergyDataDK, which was developed by the Technical University of Denmark (DTU) and its partners (see sidebar “Energy insights accelerate energy use optimization”).

2. WHERE TO FIND PROMISING ENERGY DATA SOURCES
Energy data can originate from two major distinct sources:
-
Traditional system market players — grid operators, balance responsible parties, energy suppliers.
-
Nontraditional market players — the real estate sector, original equipment manufacturers (OEMs), e-mobility providers.
Both sources are introducing new products and services, generating a richness of energy data relevant to the operations of the evolving energy landscape. They can use the raw data that is directly disclosed at the smart meter or the validated data that is transferred via the data chain, depending on the product or service.
In some countries, it is or will be required by law for traditional data registers to provide certain data products to the market for free. This is happening already in the Netherlands, where grid operators, closed distribution system operators, and parties responsible for meters must disclose specific energy data products for free.
DATA FROM TRADITIONAL SYSTEM MARKET PLAYERS
Consumption & injection registers
By far, the most valuable energy data source comes from the electricity consumed by and injected into the grid. As we are transitioning toward a supply-driven energy landscape (an increase of variable, weather-dependent energy sources) while also becoming more electricity-intensive, there is a growing need for granular and near-real-time energy data to perform effective and automated demand-side control.
Technical registers
The introduction of smart meters has given system market parties insight into a goldmine of consumption data. Collecting technical data such as meter event information (e.g., outages), voltage information, and peak power can provide a grid company with a 360-degree view of the meter that supports asset management and system operations. Real-time voltage information helps grid operators visualize and monitor the low-voltage network and perform data-driven congestion management. On the other hand, peak power data shows when household consumption is highest, leading to energy allocation based on new mechanisms, such as dynamic capacity tariffs. This method will be introduced in Flanders, Belgium (see sidebar “Introducing capacity tariff in Belgium”).

Asset data
In addition to energy usage information, asset data about the meter is useful for system market parties, mainly for system operators. It includes general meter information such as its age, type, and capacity; it also shares schedules of recent and upcoming software updates and meter maintenance. This data allows system market parties to anticipate potential problems with reading meter data.
DATA FROM NONTRADITIONAL MARKET PLAYERS
Diversifying data types allows new market players to combine metering data with external data to introduce new services. New sources of energy data are being unlocked; these include real estate registers and government demographic registers. OEMs provide another source of data, especially from heat pumps, electric boilers, washing machines, and charge poles (see Figure 2 and sidebar “A tool to evaluate the impact of energy transition”).


3
DESIGNING A FUTURE-READY SMART METERING LANDSCAPE
Understanding smart meter data sources is key to retrieving the right data for its corresponding use case:
-
Energy-efficiency monitoring. Green loans are granted based on a building’s post-renovation energy-efficiency improvements. The required data points don’t need to have high granularity; they do not need to be real-time or instantly available, either. Instead, efficiency improvements can be identified and assessed by creating an energy consumption profile. An energy consumption profile based on aggregated data taken before and after the renovations should be sufficient to identify and assess the energy-efficiency improvements.
-
Demand response. More granular data is needed to enable residential demand response, as these events can be triggered, for example, from 2 pm to 5 pm. Daily aggregated data will not be sufficient here. Typically, most European countries already take 96 meter readings per day (equal to one every 15 minutes), which enables effective demand-response market support.
-
Congestion management. A grid operator needs near-real-time or real-time voltage information on the street or household level to effectively enable local congestion management and initiate the necessary dispatch actions. Acquiring this data in a timely manner once a critical congestion event occurs is a key step in addressing the problem.
The principles above capture key design criteria for a future-ready smart meter data value chain (see Figure 3):
-
Modular metering value chain. The meter data value chain should be flexible enough to adapt to uncertain future scenarios and requirements in the energy landscape. It should allow for easy integration with system operations and asset management and facilitate the introduction of new utilities such as water, hydrogen, and heat.
-
Controllable. Introducing more variable and sustainable resources makes the energy landscape driven by supply, instead of demand. Monitoring and steering the behavior of end consumers will be required to optimally manage the grid and prevent power outages.
-
Uniform data access. Data must be equally accessible to all parties with permission to use it.
-
Diversified. Smart meters can disclose more than consumption data. Insights that focus on events, voltage, and generation can be shared to inform emerging use cases.
-
Performant. The architecture must be prepared and scalable to process increasing amounts of data.
-
Secure metering landscape. Cybersecurity should be central to both the processes and architecture, given the increasing integration of metering data into the system operations of strategic energy infrastructure. Ensuring data privacy across the entire chain from source to end user also relies on solid cybersecurity.
-
Consumer control. Full control and transparency to grant energy data access to commercial parties should be given to the consumer.
-
Affordable societal cost. Adapting the meter data value chain will trigger costs to optimize in line with the system’s needs and benefits.
-
Customer-centric. The customer’s touch points within the metering value chain should allow for simple, timely, and transparent handling, with a focus on self-service and first-line support enablement.

4
UNLOCKING ENERGY DATA — A GOVERNANCE VIEW
To meet the challenges of sustainability and customer-centricity, it is critical for energy network operators to collaborate with nontraditional partners, regulators, and competitors. This cooperation relies on consumer data from smart meters, but data sharing is currently difficult due to issues with quality, governance, confidentiality, and availability. The complexity and challenges can be overcome through a combination of collaboration and customer-centricity, often enabled by regulatory push. A regulatory framework is required to set legislative ground rules for collaboration and data sharing, which must be backed by robust customer data consent mechanisms and a cross-industry IT structure to support data exchange. The Netherlands has initiated a regulatory framework with these characteristics (see sidebar “Case study — A nationwide energy data exchange framework in the Netherlands”).

5
UNLOCKING ENERGY DATA — SMART METER ARCHITECTURE VIEW
Four main metering landscape archetypes are presented below (see Figure 4), ranging from heterogeneous, slow, point-to-point data sharing to a highly homogeneous meter data value chain with local real-time data disclosure.
-
The first archetype displays a complex hetrogenous and often cost-ineffective setup. Meter data is delivered after a long delay to the market, where every market party requires a point-to-point nonstandardized integration with each individual DSO or other data-disclosing entity.
-
In the second archetype, the decentralized heterogenous point-to-point integrations are unified in a central market system (CMS), facilitating ease and uniformity of exchange across market parties. The process for incident analysis and handling data-exchange issues where data was not delivered is cumbersome because of the individual DSO’s customized Advanced metering infrastructure (AMI) landscapes, which enable two-way communication with the digital meters.
-
The third archetype is characterized by uniform data handling closer to the smart meters. All heterogenous decentralized AMIs are reduced to one uniform AMI functionality that collects data of all smart meters. This is possible through one central application operated by all data-disclosing entities, or multiple applications, operated by the individual entities, that run the same software and business logic. The central asset register from the central market system must be maintained in order to deliver data to the correct market parties. This register collects all the contracts between market parties and consumers as well as mutations such as moves and switches.
-
The last archetype introduces a local edge gateway on the meter. The gateway calculates and communicates, supported by edge technology, artificial intelligence, and Internet of Things, while the core meter’s tasks are limited to measuring the electricity flow. This offers the possibility for real-time data disclosure to support the introduction of new advanced applications. Additionally, local processing allows for offloading heavy centralized processes. Local processing lowers the risk for security breaches by avoiding duplications and dispersions of personalized data in centralized systems. The UK market has gateways already in place for pure communication purposes, but in the Netherlands, the commercialization of an edge gateway with extended functionality is being explored.

The communication functionality of the CMS and the centralized AMI focuses on data export. A parallel data lake can be constructed to perform further calculations and create aggregates with the collected data without interrupting the core data-export processes. This system needs to be highly available and high-performing, accessible via APIs by many concurrent users. Similar API structures are being used in open banking, as explained in the case study.
Regardless of structure, there is no doubt that the amount of collected data will significantly increase in the near future. Introducing a centralized consent platform to manage larger volumes of data is increasingly important. The platform’s process has three steps, which we refer to as IAA: identification (establishing someone’s identity), authentication (confirming their identity), and authorization (verifying authority to grant permission). The consumer receives a clear overview of all the authorizations he or she has given. In the case of the decentralized gateway structure, it is possible to have local IAA functionality to communicate data directly from the smart meter to the market party without passing through a central metering system.
CONCLUSION
CAPTURING ENERGY DATA OPPORTUNITIES
There is consensus that energy data will be the cornerstone in establishing a stable, secure future power supply. Rethinking how this data is unlocked and distributed to market participants in a uniform, transparent way should be a top priority. Failure to understand this landscape means jeopardizing the security and quality of the energy supply and missing new (commercial) business models. In this Report, we highlighted the need for better open data, explored traditional and new sources, showed the benefits of smart metering, and recommended setups for governance and architecture. Ultimately, multiple enablers are the key to maximizing the vast opportunities in energy data. Although specific regions, such as the EU, are forerunners in using energy data, the opportunities and challenges will be relevant across the globe. Key takeaways for market players include:
-
Open energy data sharing should be promoted and embedded in regulatory mechanisms to optimize the overall system cost of the energy landscape.
-
An effective data governance forum on market level accelerates collaboration and use case development and encourages joint decision-making among new and existing players.
-
Stricter privacy legislation will protect the end consumer and give them full control of their data. Investing in quality user experiences across the energy data value chain will promote participation and use case valorization.
-
End consumers will be pursued by third parties wanting to exploit inherent data value. This occurs beyond the energy sector, in financial services, automotive, telecoms, and others.
-
Countries are developing centralized consent management to enable transparency and control of energy data utilization; IT platforms facilitate end consumer IAA of energy data usage for products and services.
-
There is no “one size fits all” for data sources. Specific sources need to be tapped into based on use case. Understanding the energy data value chain and its possibilities and limitations is critical in assessing a new energy product or service’s viability.
-
Data register operators should focus on standardizing the end-to-end metering architecture with modularization and security at its core to keep pace with fast-evolving trends and higher numbers of data transactions.
-
Metering architecture must be redesigned to unlock real-time energy data use cases and support direct data distribution from the meter to the authorized market party. Maintaining central infrastructure will ensure calculation of the energy balance to perform allocation and reconciliation activities.
DOWNLOAD THE FULL REPORT
