DOWNLOAD
4 min read
Future of mobility – Driving differentiation in a world of disruption and creativity

Mobility systems face increasing pressures from rising demand and new market entrants. The latest Arthur D. Little Urban Mobility Index shows that mobility systems in the average city operate at less than half of their potential – this article explains the five key dimensions that players must embrace if they are to successfully transform themselves.
The world is changing at a faster pace than ever, making the reform of mobility systems one of the key challenges facing cities today. The global demand for passenger mobility in urbanized areas is set to double by 2050, which puts increased pressure on existing systems. Even stronger growth is expected in the field of goods mobility, especially in cities, due to the increasing importance of e-commerce and the accompanying boom in demand for last-mile delivery. With rising demand and evolving needs, mobility solution providers therefore have to satisfy a requirement for services that are increasingly convenient, fast and predictable. In parallel, major technological developments, such as big data, artificial intelligence and the Internet of Things, as well as the emergence of innovative, compact forms of energy, have opened up a range of new options for individual mobility. This has led to the successful introduction and rapid penetration of new mobility solutions. Meanwhile, traditional mobility ecosystems have diversified, involving a wider range of players. The emergence of new concepts, such as mobility-as-a-service (MaaS), will force ecosystems to reorganize interactions among everyone involved to optimize how they operate.

Current trends and new solutions may lead to very different mobility ecosystems in the future. This evolution triggers a number of opportunities, but also presents key challenges for transport authorities, as well as for mobility solution providers – whether they are traditional players or “new mobility” players. They need to master these challenges if they are to remain competitive in the short term and relevant in the long term.
The need for a paradigm shift
In many urban areas, the quality and performance of mobility services are deteriorating. While this does not apply to every urban center, there is clear evidence that we have reached a point in all megacities when steady improvement through incremental change will not be enough to cope with the challenges to come. This means cities need to undergo a transformative paradigm shift when it comes to urban mobility.
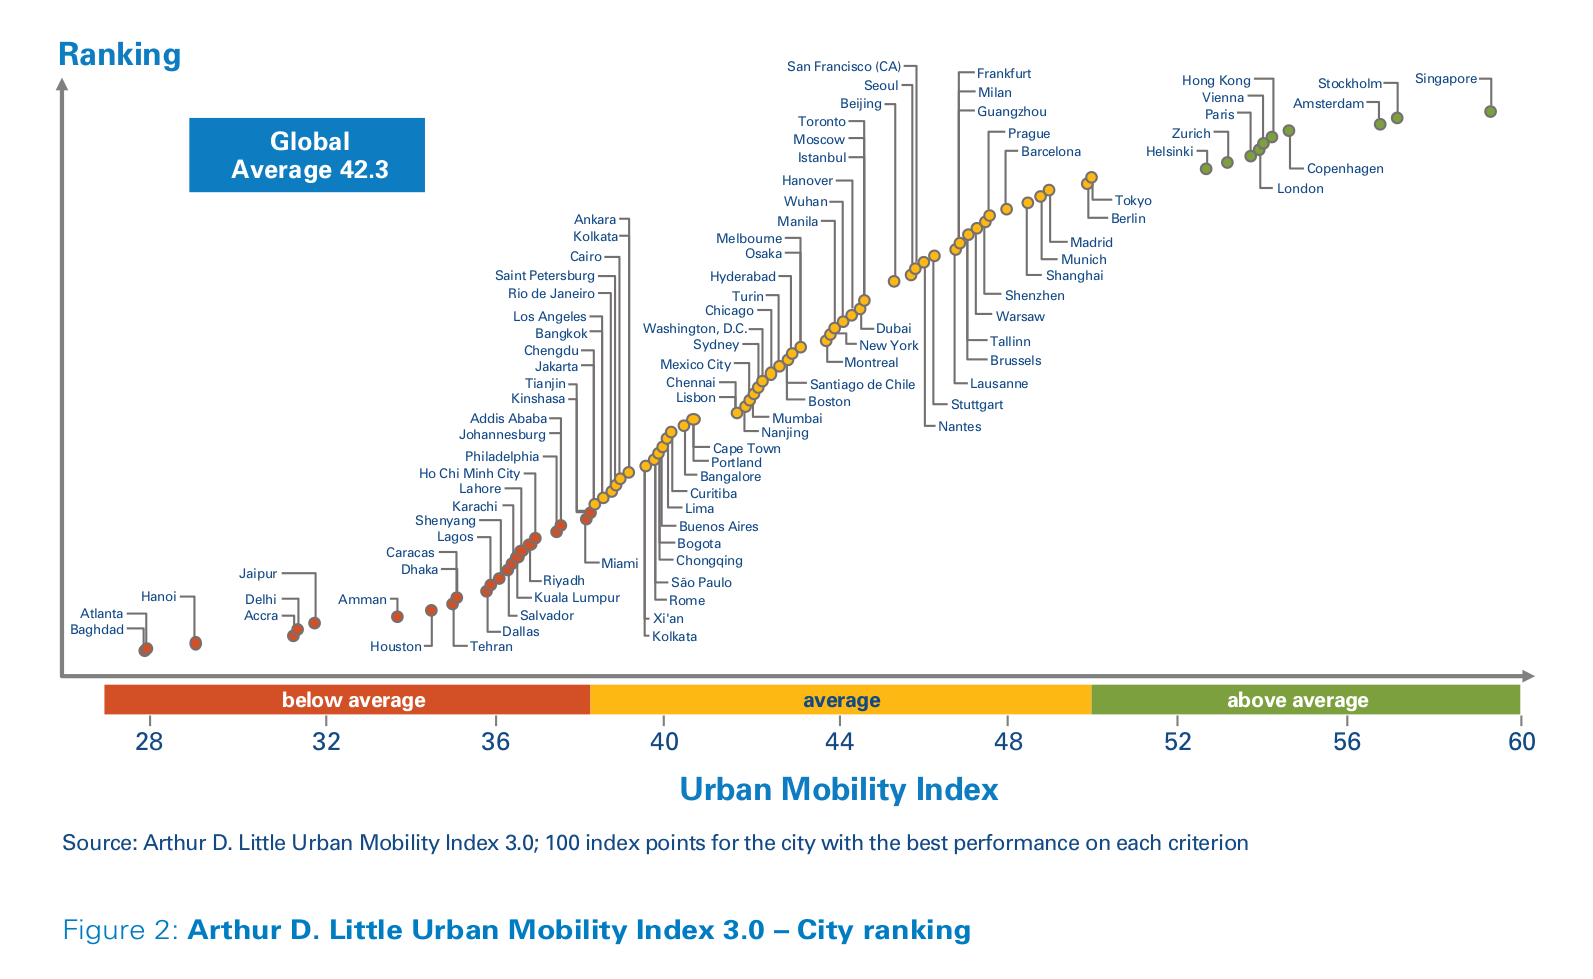
While movement of people and goods is a prerequisite for economic development, non-movement – i.e., traffic congestion – constitutes the biggest complaint of urban households and businesses. Between 2008 and 2016, the overall rate of road-traffic congestion has been increasing by 2.6 percent per annum in urban areas across the world. Arthur D. Little recently released the third edition of its Urban Mobility Index 1 , assessing the mobility maturity, innovativeness and performances of 100 cities worldwide, rated on 27 criteria. The mobility score per city ranges from 0 to 100 index points, with the best-performing city for each criterion receiving the maximum 100 points.

The global average score of the cities surveyed is 42.3 out of the possible 100 points. These overall results show that most cities still need to work hard on improvements to their mobility systems if they are to cope with future challenges. Essentially, across the world the average city has unleashed less than half of the potential of its urban mobility system, a state of affairs that could be remedied by applying best practices across all its operations.
Only 10 cities scored more than 50 points, out of which eight are European and two Asian. The highest score was achieved by the city-state of Singapore with 59.3 points, followed by Stockholm (57.1 points), Amsterdam (56.7 points), Copenhagen (54.6 points) and Hong Kong (54.2 points). These scores indicate that even the highest-ranking cities have considerable potential for improvement. For example, Singapore’s position in the index is due to the development of a clear vision and strategy at government level, including fiscal incentives to positively influence mobility behaviors. Unprecedented efforts have also been made in the field of “new mobility”, among others, through development of shared mobility solutions and a pioneering approach to autonomous driving. This has been enabled by nurturing the creation of partner ecosystems combining both the public and private sectors.
Comparing those results with the previous edition of Arthur D. Little’s Urban Mobility Index, carried out in 2013 across 84 cities, enables some interesting analysis:
- The average amount of transport-related CO2 emissions per capita has decreased by 3 percent (from 1,506 to 1,464 tons). This is an insufficient improvement speed to meet the decarbonization commitments of the Paris COP 21 agreement.
- The share of public transport in the transport modal split has increased by 2 percent (from 29 to 31 percent), while motorized individual transport (i.e., cars) has decreased by 2 percent (from 42 to 40 percent). The share of non-motorized transport (walking and cycling) remained stable. However, at the same time, due to the overall increase in demand for mobility driven by developing regions, motorization increased by 5 percent over the period.
- “New mobility” solutions have gained traction since the last report, with an increase of 54 percent in car-sharing and bike-sharing by a factor of 10.7 (although this started from a very low basis). There was a 27 percent increase in the penetration of mobility cards (or their digital counterparts).
While these are positive evolutions, there are significant questions around whether the pace of change will be fast enough to adapt to the changes required in mobility.

4 min read
Future of mobility – Driving differentiation in a world of disruption and creativity


Mobility systems face increasing pressures from rising demand and new market entrants. The latest Arthur D. Little Urban Mobility Index shows that mobility systems in the average city operate at less than half of their potential – this article explains the five key dimensions that players must embrace if they are to successfully transform themselves.
The world is changing at a faster pace than ever, making the reform of mobility systems one of the key challenges facing cities today. The global demand for passenger mobility in urbanized areas is set to double by 2050, which puts increased pressure on existing systems. Even stronger growth is expected in the field of goods mobility, especially in cities, due to the increasing importance of e-commerce and the accompanying boom in demand for last-mile delivery. With rising demand and evolving needs, mobility solution providers therefore have to satisfy a requirement for services that are increasingly convenient, fast and predictable. In parallel, major technological developments, such as big data, artificial intelligence and the Internet of Things, as well as the emergence of innovative, compact forms of energy, have opened up a range of new options for individual mobility. This has led to the successful introduction and rapid penetration of new mobility solutions. Meanwhile, traditional mobility ecosystems have diversified, involving a wider range of players. The emergence of new concepts, such as mobility-as-a-service (MaaS), will force ecosystems to reorganize interactions among everyone involved to optimize how they operate.

Current trends and new solutions may lead to very different mobility ecosystems in the future. This evolution triggers a number of opportunities, but also presents key challenges for transport authorities, as well as for mobility solution providers – whether they are traditional players or “new mobility” players. They need to master these challenges if they are to remain competitive in the short term and relevant in the long term.
The need for a paradigm shift
In many urban areas, the quality and performance of mobility services are deteriorating. While this does not apply to every urban center, there is clear evidence that we have reached a point in all megacities when steady improvement through incremental change will not be enough to cope with the challenges to come. This means cities need to undergo a transformative paradigm shift when it comes to urban mobility.
While movement of people and goods is a prerequisite for economic development, non-movement – i.e., traffic congestion – constitutes the biggest complaint of urban households and businesses. Between 2008 and 2016, the overall rate of road-traffic congestion has been increasing by 2.6 percent per annum in urban areas across the world. Arthur D. Little recently released the third edition of its Urban Mobility Index 1 , assessing the mobility maturity, innovativeness and performances of 100 cities worldwide, rated on 27 criteria. The mobility score per city ranges from 0 to 100 index points, with the best-performing city for each criterion receiving the maximum 100 points.

The global average score of the cities surveyed is 42.3 out of the possible 100 points. These overall results show that most cities still need to work hard on improvements to their mobility systems if they are to cope with future challenges. Essentially, across the world the average city has unleashed less than half of the potential of its urban mobility system, a state of affairs that could be remedied by applying best practices across all its operations.
Only 10 cities scored more than 50 points, out of which eight are European and two Asian. The highest score was achieved by the city-state of Singapore with 59.3 points, followed by Stockholm (57.1 points), Amsterdam (56.7 points), Copenhagen (54.6 points) and Hong Kong (54.2 points). These scores indicate that even the highest-ranking cities have considerable potential for improvement. For example, Singapore’s position in the index is due to the development of a clear vision and strategy at government level, including fiscal incentives to positively influence mobility behaviors. Unprecedented efforts have also been made in the field of “new mobility”, among others, through development of shared mobility solutions and a pioneering approach to autonomous driving. This has been enabled by nurturing the creation of partner ecosystems combining both the public and private sectors.
Comparing those results with the previous edition of Arthur D. Little’s Urban Mobility Index, carried out in 2013 across 84 cities, enables some interesting analysis:
- The average amount of transport-related CO2 emissions per capita has decreased by 3 percent (from 1,506 to 1,464 tons). This is an insufficient improvement speed to meet the decarbonization commitments of the Paris COP 21 agreement.
- The share of public transport in the transport modal split has increased by 2 percent (from 29 to 31 percent), while motorized individual transport (i.e., cars) has decreased by 2 percent (from 42 to 40 percent). The share of non-motorized transport (walking and cycling) remained stable. However, at the same time, due to the overall increase in demand for mobility driven by developing regions, motorization increased by 5 percent over the period.
- “New mobility” solutions have gained traction since the last report, with an increase of 54 percent in car-sharing and bike-sharing by a factor of 10.7 (although this started from a very low basis). There was a 27 percent increase in the penetration of mobility cards (or their digital counterparts).
While these are positive evolutions, there are significant questions around whether the pace of change will be fast enough to adapt to the changes required in mobility.


